In this note, we provide five reasons why we do not have positions in Citigroup (C), JPMorgan (JPM), Bank of America (BAC), Goldman Sachs (GS), or Morgan Stanley (MS), despite the fact that these banks/brokers are very inexpensive, trading near or below TBV. In fact, their lower valuations are directly linked to the fact their ROEs remain below their cost of capital (although JPM is close).
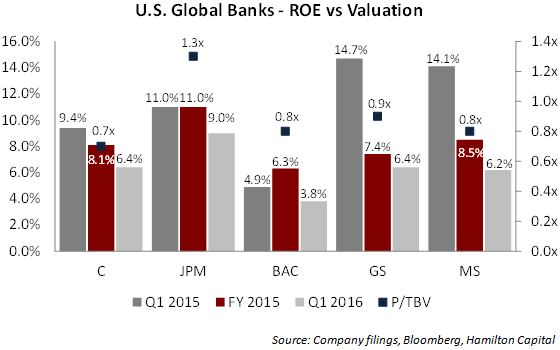
How low are their ROEs? As the chart below highlights, despite Q1 traditionally being seasonally strong for the very important fixed income trading business (referred to as FICC), the ROEs in Q1 2016 for Citigroup, Goldman Sachs, and Morgan Stanley were just over 6.0%, while Bank of America was below 4.0%.[1]
Therefore, while it is true that these banks trade at or below TBV, it is also true that it will be extremely difficult for them to benefit from absolute multiple expansion until their ROEs materially rise. This looks to be difficult given the intense earnings headwinds, meaning buying these banks on the expectation of rising ROEs is problematic. In Q1, on average, ROEs actually declined over 400 bps year-over-year.
Here are five reasons we don’t own these five mega banks/brokers.
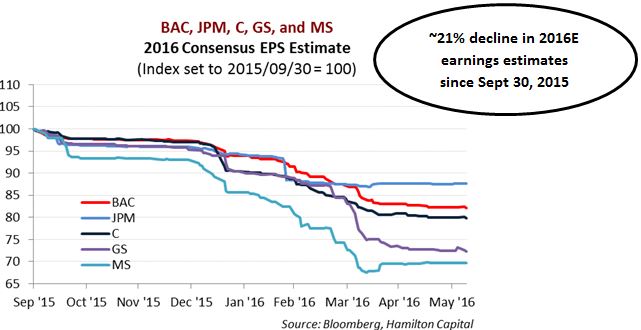
First, as the chart below shows, pressure on earnings forecasts has not abated. Consensus 2016E estimates have already been reduced 21% (on average) for the five banks since last fall, as global investment banking continues to struggle and credit costs in energy rise. Global M&A deals have plummeted in 2016; completed and announced YTD volumes are down 14% and 30%, respectively[2]. Equity issuances have also lagged reported levels from 2015[3], while fixed income trading continues to be under pressure. Although market volatility has somewhat subsided from the first few months of 2016, expected rebounds in capital markets revenues in the latter half of the year are not expected to make up for lower revenues from Q4/2015 and Q1/2016.
Second, these mega-caps have materially less interest rate sensitivity than their regional and, especially, mid-cap peers. With the Federal Reserve expected to continue its progression of rate increases (albeit at a slow pace), the smaller U.S. banks should benefit more than the largest financial institutions (on a relative basis).
Third, regulatory risk remains high for the larger institutions; new unexpected regulatory issues continue to emerge. Two Federal Reserve governors suggested this month that the largest 8 banks in the U.S. (including those highlighted in this note) would need to hold additional equity in order to pass their annual stress tests, a policy move which would be negative for ROEs. A recent CFPB proposal to allow class action lawsuits against financial services companies was also reported. In contrast, there is significant political pressure to alleviate the regulatory burden on small and mid-cap banks, with legislation being proposed that would increase the companies’ asset-based thresholds for additional capital requirements / regulatory oversight (currently at $10 bln and $50 bln, respectively).
Fourth, unlike the mid-cap U.S. bank peers (i.e., assets less than US$75 bln), which continue to consolidate, there is no M&A theme for the mega-caps (JPM and BAC are actually above their statutory domestic deposit cap). The larger banks are much more dependent on organic revenue growth (which is stagnant) than their mid-cap peers. In addition to organic avenues, the mid-cap banks are also able to grow revenues through material acquisitions and support earnings increases through the accompanying synergies. Owning banks with less than $100 bln in assets also provides the potential to receive an acquisition premium if they are a take-over target, which is a non-existent scenario for the mega-caps. With over 100 publicly-traded banks, we are able to identify those with higher growth, either from superior execution, or because they are domiciled in states / MSAs with higher GDP growth.
And fifth, the banks have very low dividend yields, and for large-cap financials, higher dividends yields can offer some form of downside protection in corrections. JPM, BAC, GS, and MS have dividend yields of 3.0%, 1.4%, 2.3%, and 1.7%, respectively. C’s dividend yield is one of the lowest in U.S. banking at 0.5% (although, likely to rise).
Notes
[1] Note: JPMorgan Chase does not disclose return on equity to multiple decimal places.
[2] Source: KBW. As at June 3, 2016. 2015 is annualized assuming the YTD run rate for the remainder of the year.
[3] Source: KBW. U.S. equity capital markets revenues down 26% year-over-year.


