Our overall goal for the Hamilton Enhanced Multi-Sector Covered Call ETF (HDIV) and the Hamilton Enhanced U.S. Covered Call ETF (HYLD, HYLD.U) is to create higher income ETF versions of the S&P/TSX 60 and S&P 500, respectively. As part of these two funds, we have modest cash leverage of 25%, the purpose of which is to help mitigate the yield/return trade-off inherent in covered call strategies, and to enhance monthly income. In the last twelve months, this portfolio structure proved resilient. Since it was launched in July 2021, HDIV has outperformed the S&P/TSX 60 by 7.2%, or 4.4% annualized[1].
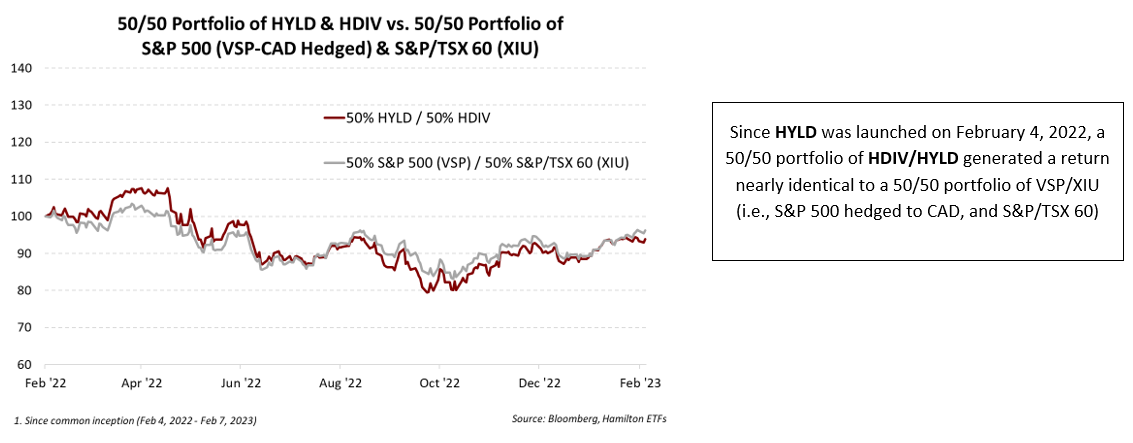
Moreover, as the chart below highlights, a 50/50 portfolio of HDIV/HYLD produced VERY similar returns to a 50/50 portfolio of the XIU/VSP which provide exposure to the S&P/TSX 60 and the S&P 500 (CAD-hedged), respectively[2].

We believe this provides significant support for our view that these two ETFs can serve as complementary core holdings for investors seeking higher monthly income from Canadian and U.S. equity markets. Although the sector mixes for each ETF are “broadly similar” – but not exact – to these large benchmark indices, we aim for similar returns and relatively high correlations going forward in modest markets. That said, it is important to note that should the markets rally sharply, this 50/50 portfolio is likely to lag these two benchmark indices as the covered call strategies used to generate higher income may weigh on returns more than the modest leverage would add to returns.
In this insight we discuss a recent change to HDIV, and why we believe it will help better achieve HDIV’s investment objective while (i) increasing correlation to the S&P/TSX 60, (ii) increasing underlying yield, and (iii) reducing “all-in” fees. After its recent increase in its distribution, the current yield of HDIV is 9.9%[3], paid monthly.
Selling ZWB; Adding Hamilton Canadian Financials Yield Maximizer ETF (HMAX)
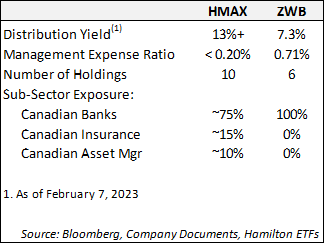
In HDIV, we added the Hamilton Canadian Financials Yield Maximizer ETF (HMAX) and sold the BMO Covered Call Canadian Banks ETF (ZWB). HMAX is more diversified with ~75% Canadian banks, ~10% Brookfield, and ~15% Canadian insurers, while ZWB is 100% Canadian banks. As the table highlights, HMAX offers the following advantages over ZWB, including: (i) significantly higher yield (over ~6% higher[4]), and (ii) <0.20% MER to HDIV unitholders versus ZWB at 0.71%[5].
Why HMAX/HFIN or HMAX/HCAL versus ZWB
We believe a combination of either HMAX/HFIN, or HMAX/HCAL is a superior way to gain exposure to the Canadian banks or financials for income-oriented investors. First, the Hamilton Enhanced Canadian Bank ETF (HCAL) is the top performing Canadian bank ETF[6] and has a yield of 6.7% versus 7.3% for ZWB. Yet, since HCAL launched in October 2020, it has outperformed ZWB by a highly material 25% (or over 8% annualized). That is substantial underperformance to absorb for an additional 0.6% of incremental yield. Moreover, since HCAL was launched in October 2020, it has outperformed the BMO Equal Weight Banks Index ETF (ZEB), the sister ETF to ZWB, by a highly material 8%[7].

Which brings us to the Hamilton Canadian Financials Yield Maximizer ETF (HMAX), which holds ~75% Canadian banks and has a targeted yield of 13%+. In general, our higher yield is achieved by writing on a higher percentage of the portfolio (~50%) and writing options at-the-money (versus out of the money). This means that investors participate in approximately 50% of the upside in a rising market. Also, in a flat to down market, HMAX could outperform by generating higher premium income. However, it is likely to underperform in a rising market, which is the trade-off to achieve a higher yield and monthly distributions.
Which brings us to HCAL and HFIN.
We believe investors seeking to optimize a return/yield trade-off for the Canadian banks and financials should consider a combination of HCAL or HFIN plus an allocation to HMAX. The former offers a mix of higher return potential, with still higher yields, while HMAX offers less upside in exchange for a materially higher yield. This is the approach we have adopted for HDIV.
For HDIV/HYLD – Going Forward, All-In Fees Decline to Approximately 1.25% (excluding financing costs)
Since the launch of HDIV and HYLD, we have been able to meaningfully reduce the “all-in” fees in two ways. First, through substitutions into lower fee ETFs, while still improving the underlying yield and improved sector alignment (and presumably correlations). Second, the growing size of both HDIV and HYLD has allowed us to negotiate bulk discount fee reductions, the effect of which will become more evident in future reporting disclosures. Going forward, we estimate the “all-in” management expenses paid for both HDIV and HYLD is now approximately 1.25% (i.e., excluding financing costs). This 1.25% brings the combined fee down to a level comparable to other all-in-one ETFs which offer a “zero” management fee.
For HDIV: Adding HMAX for Stronger Underlying Distributions and Material Reduction in Fees
Going forward, we believe these changes will strengthen the Hamilton Enhanced Multi-Sector Covered Call ETF (HDIV), by increasing the underlying distributions and materially reducing its underlying weighted average management fee.
The current yield of the Hamilton Enhanced Multi-Sector Covered Call ETF (HDIV) is 9.9%[8], paid monthly. Given the complementary nature of the two indices, we believe HDIV can serve as a core holding along with the Hamilton Enhanced U.S. Covered Call ETF (HYLD), which has a yield of 13.8%[9], paid monthly.
____
A word on trading liquidity for ETFs …
Hamilton ETFs are highly liquid ETFs that can be purchased and sold easily. ETFs are as liquid as their underlying holdings and the underlying holdings trade millions of shares each day.
How does that work? When ETF investors are buying (or selling) in the market, they may transact with another ETF investor or a market maker for the ETF. At all times, even if daily volume appears low, there is a market maker – typically a large bank-owned investment dealer – willing to fill the other side of the ETF order (at the bid/ask spread).
Commissions, management fees and expenses all may be associated with an investment in the ETFs. The relevant prospectus contains important detailed information about each ETF. Please read the relevant prospectus before investing. The ETFs are not guaranteed, their values change frequently and past performance may not be repeated.
Certain statements contained in this insight constitute forward-looking information within the meaning of Canadian securities laws. Forward-looking information may relate to a future outlook and anticipated distributions, events or results and may include statements regarding future financial performance. In some cases, forward-looking information can be identified by terms such as “may”, “will”, “should”, “expect”, “anticipate”, “believe”, “intend” or other similar expressions concerning matters that are not historical facts. Actual results may vary from such forward-looking information. Hamilton ETFs undertakes no obligation to update publicly or otherwise revise any forward-looking statement whether as a result of new information, future events or other such factors which affect this information, except as required by law.
[1] Since HDIV’s inception on July 19, 2021 through February 7, 2023, versus the iShares S&P/TSX 60 ETF (XIU).
[2] The total return was within 1% between February 4, 2022 and February 7, 2023. XIU is the iShares S&P/TSX 60 ETF and VSP is the Vanguard S&P 500 Index ETF (CAD-hedged).
[3] As at February 7, 2023
[4] Based on the indicated yield of HMAX as of February 7, 2023.
[5] Includes fees paid to sub-advisor for options, plus related taxes.
[6] Since inception on October 14, 2020, as at February 7, 2023. Based on a universe of seven Canadian bank ETFs that trade on the Toronto Stock Exchange.
[7] As at February 7, 2023
[8] As at February 7, 2023
[9] As at February 7, 2023

