U.S. banks are by far the largest portfolio within the Hamilton Capital Global Bank ETF (HBG) and over time, we expect this group will represent between 30% and 50% of the ETF. As we have written previously, we typically prefer U.S. mid-cap banks over their larger peers because they: (i) are generally more rate-sensitive, (ii) are merging, and (iii) are growing earnings faster. In fact, during earnings season, only three U.S. banks in HBG, representing ~9% of the U.S. portfolio, had assets greater than US$100 bln[1].
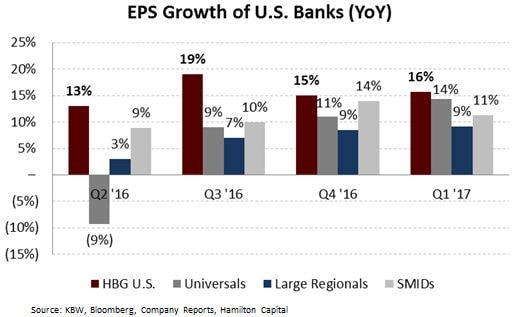
Our strategy to focus on this category of U.S. banks was affirmed once again. This quarter, EPS growth for HBG’s U.S. bank portfolio was 15%. This was the 4th consecutive quarter that EPS increased by at least 13%. It was also the 4th consecutive quarter that HBG’s U.S. bank portfolio exceeded the growth of all categories of U.S. banks, including the universals/mega-caps (+14%, aided this quarter by fixed income trading), large regionals (+9%), and small/mid-cap banks (SMIDs, +11%)[2].

The earnings outperformance of HBG’s U.S. positions was driven by multiple factors.
First, top line performance was a major contributor. Strong growth in net interest income (+22%) was driven by increases in loan portfolios (+25%), and less from expanding margins which were relatively flat (in-line with SMID peers).
In fact, given the rate hike during the quarter, we were surprised that banks in our portfolio did not see a greater lift in margins given their rate sensitivity. That stated, 50% of the holdings experienced margin expansion in the quarter, a percentage which was relatively in-line with the SMID banks in the U.S. (46%). We expect the positions to show further margin expansion in Q2, as they will have the full impact of the March rate increase, and potentially part of another one from June (odds of an increase at ~95% per Bloomberg estimates).
The growth in lending revenue for HBG’s holdings was complemented by a 22% increase in non-interest income. This far outpaced the performance of the universals (+3%), which were, as noted above, aided by strong trading quarters (on average).
Second, credit quality remained healthy for the portfolio, with net charge-offs and provisions (both annualized and as a % of average loans) a very low 13 bps and 24 bps, respectively. The charge-offs figure is a slightly higher than the SMID banks (6 bps), but much lower than the mega-caps/universals, which reported a median 59 bps over the same period (down 3 bps), largely because of their exposure to credit cards (which have higher loss ratios).
Third, we continue to focus on banks that we believe are positioned to increase operating leverage. HBG’s holdings remained focused on cost control, with revenues increasing by more than non-interest expenses, as efficiency ratios (costs/revenue) decreased by 89 bps[3]. This decline brought the weighted average efficiency ratio of the fund to below 54%, lower than large-regional (61%) and midcap peers (62%).
Profitability also expanded for HBG’s holdings, as ROE increased by 56 bps Y/Y and 20 bps Q/Q. After adjusting for one-time acquisition costs, the weighted-average ROE for the U.S. positions was ~10.0%, which as with other metrics safely exceeded the median figures for the universals (8.6%), large regionals (8.2%), and SMIDs (8.5%).
Notes
[1] All holdings and weights as at April 12, 2017, which represents the portfolio before the first U.S. holding reported Q1 earnings.
[2] Source: KBW. Median figures for 220 publicly-traded banks covered by the firm.
[3] Adjusted for one-time acquisition costs.
Note: Comments, charts and opinions offered in this commentary are produced by Hamilton Capital and are for information purposes only. They should not be considered as advice to purchase or to sell mentioned securities. Any information offered is believed to be accurate, but is not guaranteed.
