

Over the past 50+ years, U.S. equities have suffered numerous steep declines, from the inflation crisis of the early 1970’s to the current tariff turmoil of 2025. These drawdowns — ranging from moderate corrections to deep bear markets — highlight an interesting and fairly consistent pattern. When equities fall sharply, two asset classes – Bonds and Gold – perform particularly well.
This supports the premise that equities and bonds, but also equities and gold, exhibit negative correlations. In fact, a mixed asset portfolio of 60% stocks, 20% bonds, and 20% gold significantly reduces losses and improves long-term risk-adjusted returns, when compared to owning just U.S. equities. See the table below.
That’s why we designed the Hamilton Enhanced Mixed Asset ETF (MIX) — an all-in-one portfolio solution designed to deliver 1.25x the performance of the Solactive Hamilton Mixed Asset Index (“Mixed Asset Index”), which combines 60% stocks, 20% bonds, and 20% gold.
How Do Bonds & Gold Perform During Drawdowns?
Bonds have traditionally provided stability during equity market declines. During the worst drawdowns, government bond prices have tended to rise (and their yields decline) as investors seek the safety and security of high-quality, low-risk assets backed by the full faith and credit of the government. Central banks often lower interest rates during economic downturns, further boosting bond prices, helping portfolios offset equity losses.
Similarly, gold has regularly been a reliable hedge against an equity market downturn. As a safe-haven asset, gold often sees increased demand during financial crises, inflationary periods, and geopolitical uncertainty. As shown in the table below, in the 10 worst U.S. equity drawdowns, gold (in Canadian dollars) delivered positive or less severe negative returns compared to stocks, making it a valuable portfolio diversifier.
When combined, equities, bonds, and gold, in our view, create a more robust portfolio. A 60/20/20 allocation has (on average) cut equity drawdowns in half.
Gold Performance During Major Market Downturns — Top 10 Equity Drawdowns (Last 50+ Years)[1]
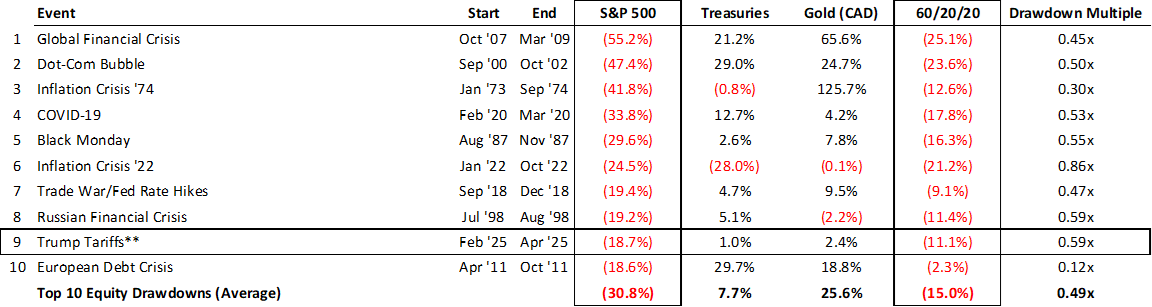
Source: S&P Global, Solactive AG, Hamilton ETFs. Past performance is not indicative of future results.
MIX — A Better Approach to Multi-Asset Investing
The Hamilton Enhanced Mixed Asset ETF (MIX) is our all-in-one portfolio designed to provide balanced exposure to equities, bonds, and gold. Additionally, MIX employs modest 25% leverage to enhance long-term growth potential while still maintaining a lower volatility profile compared to only owning U.S. equities (see charts below).
- 60% U.S. Equities: Providing growth potential through exposure to high-quality U.S. stocks.
- 20% U.S. Long-Term Treasury Bonds: Maintaining a defensive allocation to mitigate market downturns.
- 20% Gold: Improving portfolio resilience with a proven hedge against inflation and economic uncertainty.
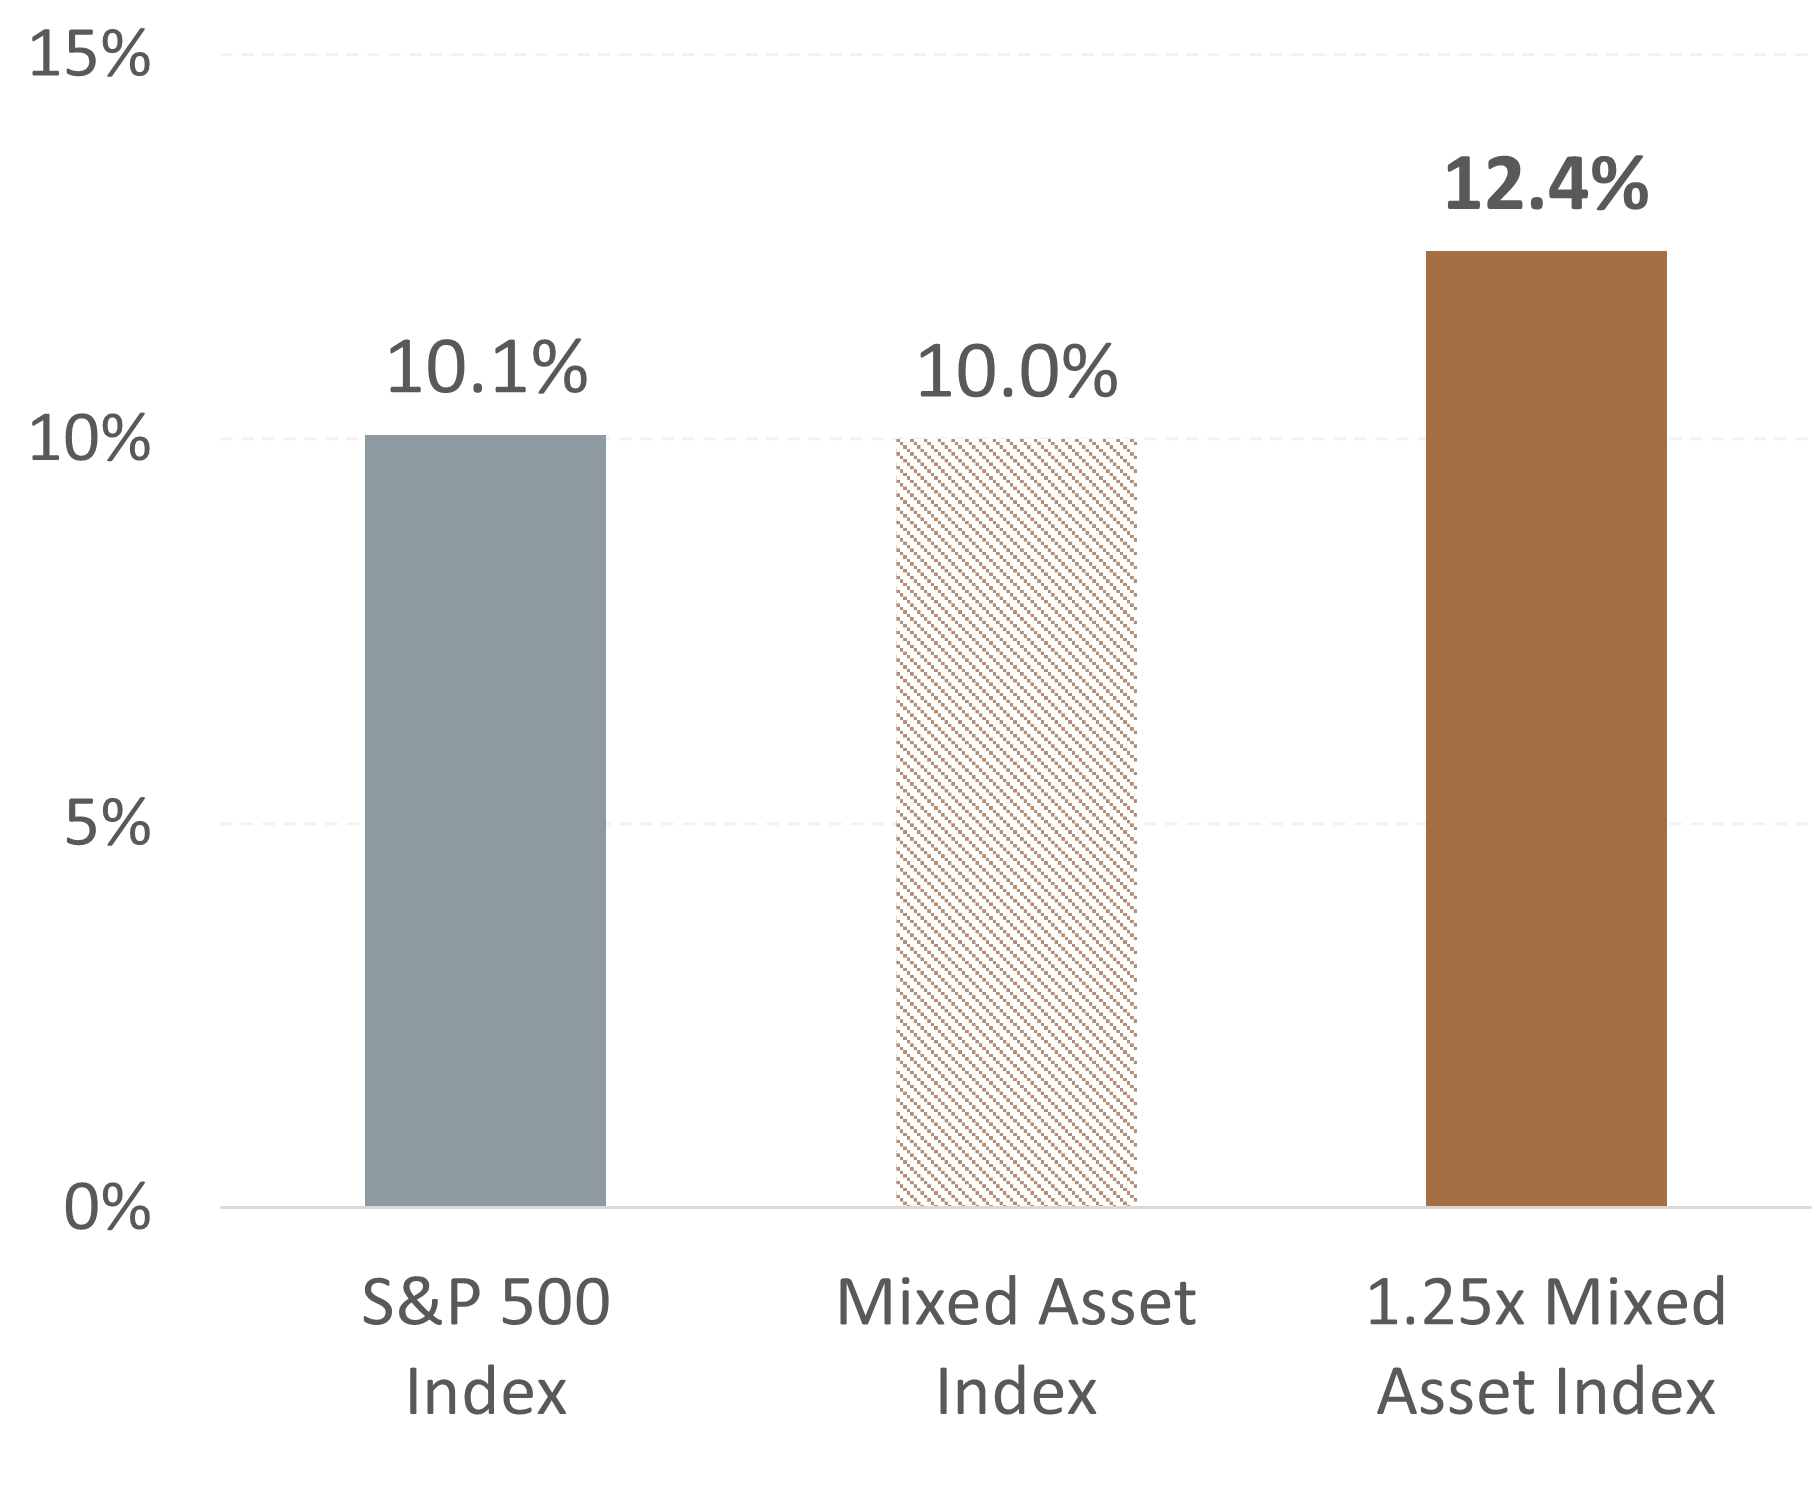
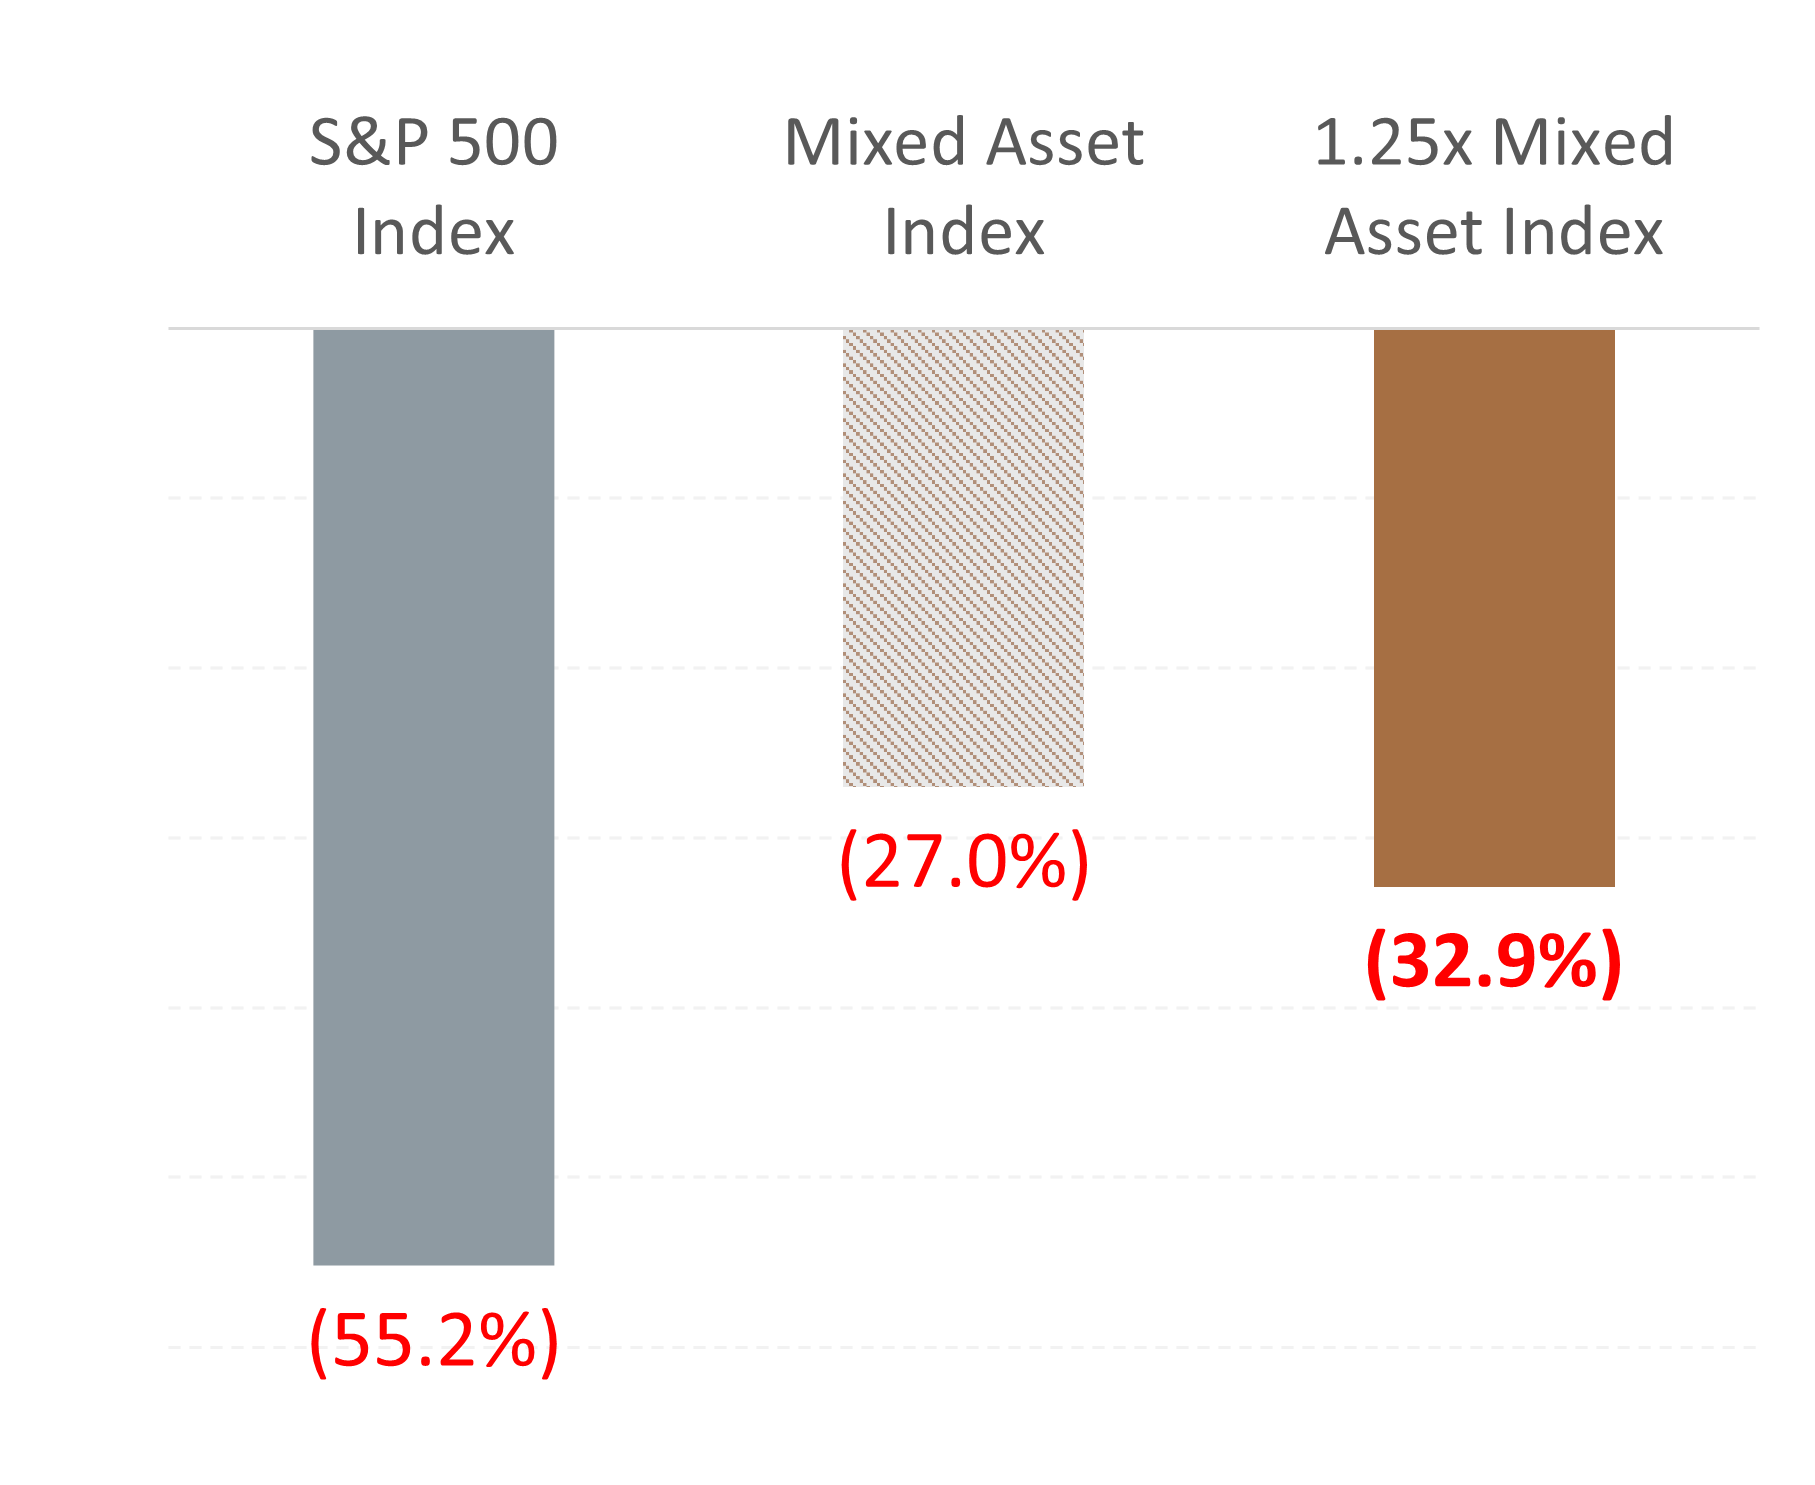
An unlevered 60/20/20 allocation across equities, bonds, and gold has been shown to enhance diversification by combining three low-correlated asset classes. This broader diversification than the typical balanced fund reduces overall portfolio volatility and drawdowns. The improvement in the risk profile is strong enough that even after 25% leverage, the portfolio has historically delivered lower volatility than equities alone—while also generating higher returns.
Returns [4]
Volatility [5]
Diversification & the Benefits of MIXed Assets
Diversification works. Bonds and gold help cushion equity market losses, and a well-constructed portfolio has historically significantly reduced volatility. By combining equities with stabilizing assets, investors can manage risk more effectively while maintaining long-term growth potential.
For Canadian investors looking to implement this strategy, the Hamilton Enhanced Mixed Asset ETF (MIX) offers a simple, effective solution. MIX provides exposure to equities, bonds, and gold in a single ETF, designed to help investors navigate market drawdowns while maintaining significant upside potential.
Key Benefits of MIX:
- Diversification Across Asset Classes: Reduces portfolio drawdowns by combining equities, bonds, and gold.
- Lower Volatility: Provides a smoother return profile with smaller losses during market declines.
- Long-Term Growth Potential: Balances risk and return for better risk-adjusted performance.
- Convenience: A single ETF solution for a diversified, resilient portfolio.
- Modest Leverage: To enhance long-term growth potential.
By focusing on a mix of growth and stability, MIX helps investors stay invested through all market conditions, reducing the financial impact of severe drawdowns. For those seeking a more balanced approach, MIX offers an efficient way to enhance portfolio resilience.
Gold Performance During Major Market Downturns — Top 50 Equity Drawdowns (Last 50+ Years)[1]
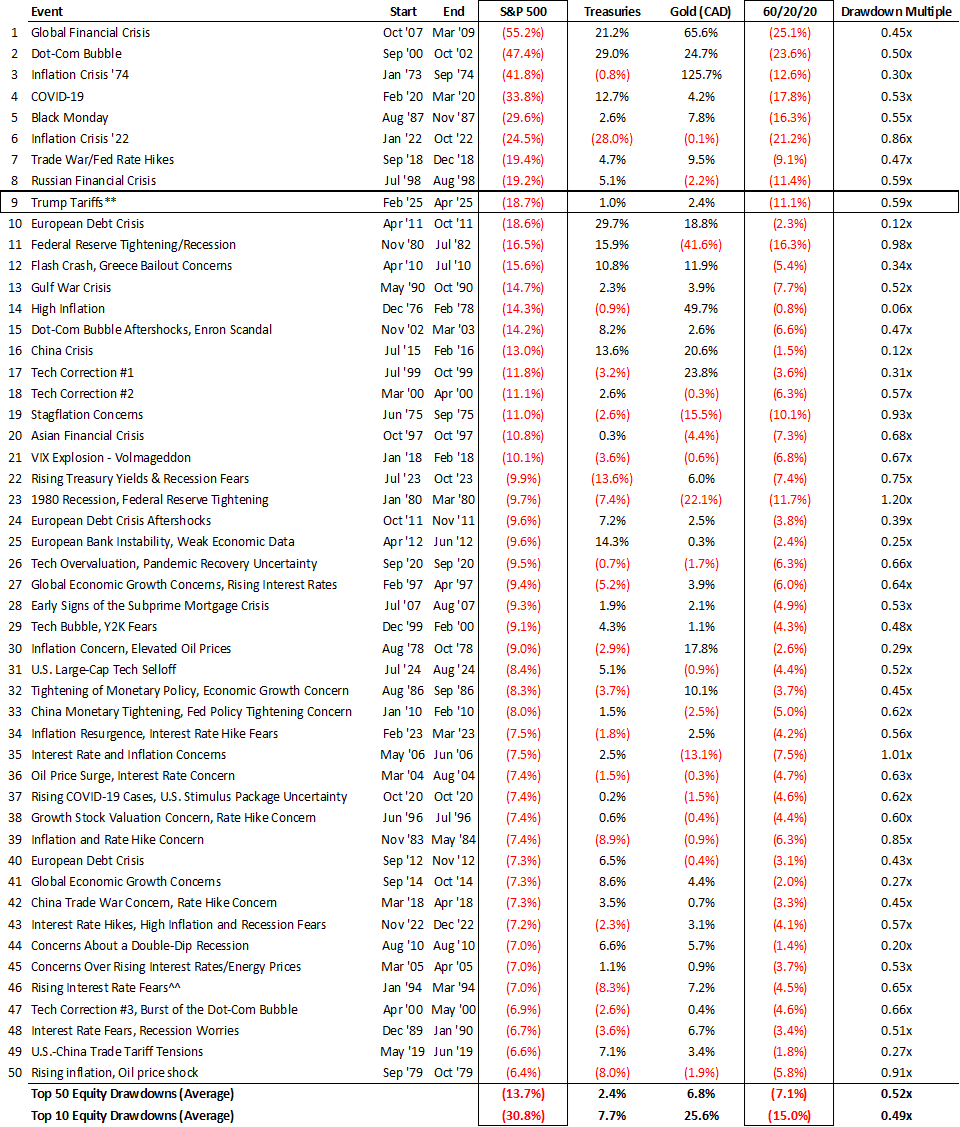
** ongoing
For more commentary, subscribe to our Insights.
____
A word on trading liquidity for ETFs …
Hamilton ETFs are highly liquid ETFs that can be purchased and sold easily. ETFs are as liquid as their underlying holdings and the underlying holdings trade millions of shares each day.
How does that work? When ETF investors are buying (or selling) in the market, they may transact with another ETF investor or a market maker for the ETF. At all times, even if daily volume appears low, there is a market maker – typically a large bank-owned investment dealer – willing to fill the other side of the ETF order (at net asset value plus a spread). The market maker then subscribes to create or redeem units in the ETF from the ETF manager (e.g., Hamilton ETFs), who purchases or sells the underlying holdings for the ETF.
____
Commissions, management fees and expenses all may be associated with investments in exchange traded funds (ETFs) managed by Hamilton ETFs. Please read the prospectus before investing. Indicated rates of return are the historical annual compounded total returns including changes in per unit value and reinvestment of all dividends or distributions and does not take into account sales, redemptions, distribution or optional charges or income taxes payable by any securityholder that would have reduced returns. Only the returns for periods of one year or greater are annualized returns. ETFs are not guaranteed, their values change frequently and past performance may not be repeated.
Certain statements contained in this website may constitute forward-looking information within the meaning of Canadian securities laws. Forward-looking information may relate to a future outlook and anticipated distributions, events or results and may include statements regarding future financial performance. In some cases, forward-looking information can be identified by terms such as “may”, “will”, “should”, “expect”, “anticipate”, “believe”, “intend” or other similar expressions concerning matters that are not historical facts. Actual results may vary from such forward-looking information. Hamilton ETFs undertakes no obligation to update publicly or otherwise revise any forward-looking statement whether as a result of new information, future events or other such factors which affect this information, except as required by law.
____
[1] Source: Solactive AG and S&P Global. Data from January 31, 1973, to March 31, 2025. Past performance is not indicative of future results.
[2] The S&P 500 Index (“Index”) and associated data are a product of S&P Dow Jones Indices LLC, its affiliates and/or their licensors and has been licensed for use by Hamilton ETFs © 2025 S&P Dow Jones Indices LLC, its affiliates and/or their licensors. All rights reserved. Redistribution or reproduction in whole or in part are prohibited without written permission of S&P Dow Jones Indices LLC. For more information on any of S&P Dow Jones Indices LLC’s indices please visit www.spdji.com. S&P® is a registered trademark of Standard & Poor’s Financial Services LLC (“SPFS”), and Dow Jones® is a registered trademark of Dow Jones Trademark Holdings LLC (“Dow Jones”). Neither S&P Dow Jones Indices LLC, SPFS, Dow Jones, their affiliates nor their licensors (“S&P DJI”) make any representation or warranty, express or implied, as to the ability of any index to accurately represent the asset class or market sector that it purports to represent and S&P DJI shall have no liability for any errors, omissions, or interruptions of any index or the data included therein.
[3] “Treasuries” is represented by Bloomberg US Long Treasury Total Return Index Value Unhedged (LUTLTRUU Index).
[4] Source: S&P Global, Solactive AG, Hamilton ETFs. Data from November 18, 2004, to March 31, 2025.
The graph illustrates the growth of an initial investment of $100,000 in USD the Solactive Hamilton Mixed Asset Index (SOLHAMMA) vs. the S&P 500 Total Return Index with annual compounded total returns and the potential impact of 1.25x leveraged exposure to SOLHAMMA. The graph is for illustrative purposes only and intended to demonstrate the historical impact of the indexes compound growth rate. It is not a projection of future index performance, nor does it reflect potential returns on investments in the ETF. Investors cannot directly invest in the index. All performance data assumes reinvestment of distributions and excludes management fees, transaction costs, and other expenses which would have impacted an investor’s returns. SOLHAMMA data prior to March 31, 2025, is hypothetical back-tested data using actual historical market data. Actual performance may have been different had the index been live during that period.
The S&P 500 Index (“Index”) and associated data are a product of S&P Dow Jones Indices LLC, its affiliates and/or their licensors and has been licensed for use by Hamilton ETFs © 2025 S&P Dow Jones Indices LLC, its affiliates and/or their licensors. All rights reserved. Redistribution or reproduction in whole or in part are prohibited without written permission of S&P Dow Jones Indices LLC. For more information on any of S&P Dow Jones Indices LLC’s indices please visit www.spdji.com. S&P® is a registered trademark of Standard & Poor’s Financial Services LLC (“SPFS”) and Dow Jones® is a registered trademark of Dow Jones Trademark Holdings LLC (“Dow Jones”). Neither S&P Dow Jones Indices LLC, SPFS, Dow Jones, their affiliates nor their licensors (“S&P DJI”) make any representation or warranty, express or implied, as to the ability of any index to accurately represent the asset class or market sector that it purports to represent and S&P DJI shall have no liability for any errors, omissions, or interruptions of any index or the data included therein.
[5] Source: S&P Global, Solactive AG, Hamilton ETFs. Data from November 18, 2004, to March 31, 2025.
Volatility is measured using standard deviation, which quantifies how much an investment’s returns deviate from its average return over a given period.