
HAMILTON CHAMPIONS™ U.S. Dividend Index ETF
U.S. All-Star Dividend Growers

HIGHLIGHTS
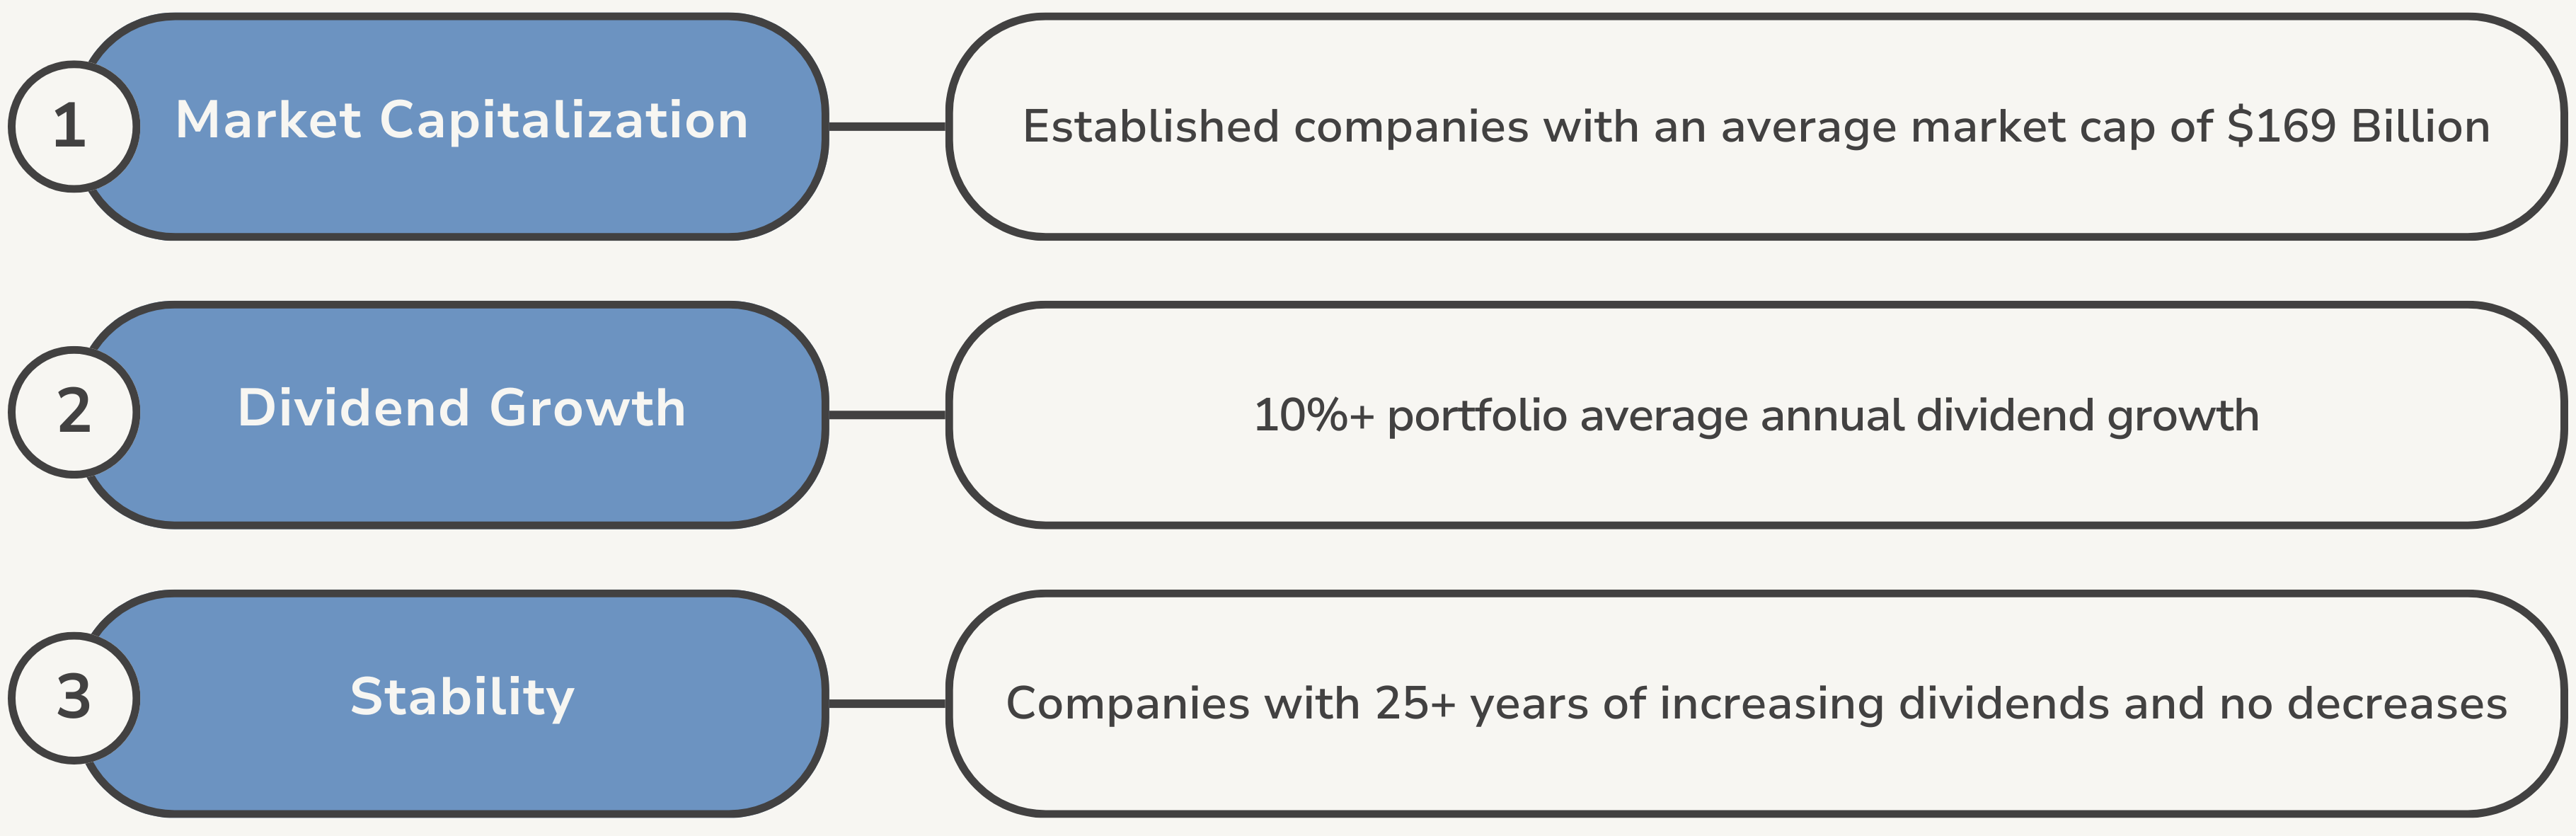
Equal-weight portfolio of blue-chip U.S. companies with a long history of stable and increasing dividend payments
0% management fee through January 31, 2026*Annual management fee rebated by 0.19% to an effective management fee of 0.00% at least until January 31, 2026
Lower volatility vs. S&P 500 with similar long-term performance*Based on total return of the Solactive United States Dividend Elite Champions Index vs. S&P 500 Index. Since November 1, 2006 as at March 31, 2025. Source: Bloomberg, Solactive AG, Hamilton ETFs
A GOOD FIT FOR INVESTORS WHO WANT
Diversified portfolio of U.S. dividend growers that have delivered strong performance and low volatility
Low-cost U.S. dividend growth ETF
100% CAD-hedged
Monthly distributions


Performance
- TICKER SMVP
- NAV $15.46
- 1 DAY CHANGE -$0.07
-
LAST DISTRIBUTION *
Last distribution per unit. Distributions are subject to change. For a complete list of historical distributions, please see the Distributions tab below.
$0.024 - ASSETS $10.2M
SMVP — Index Performance
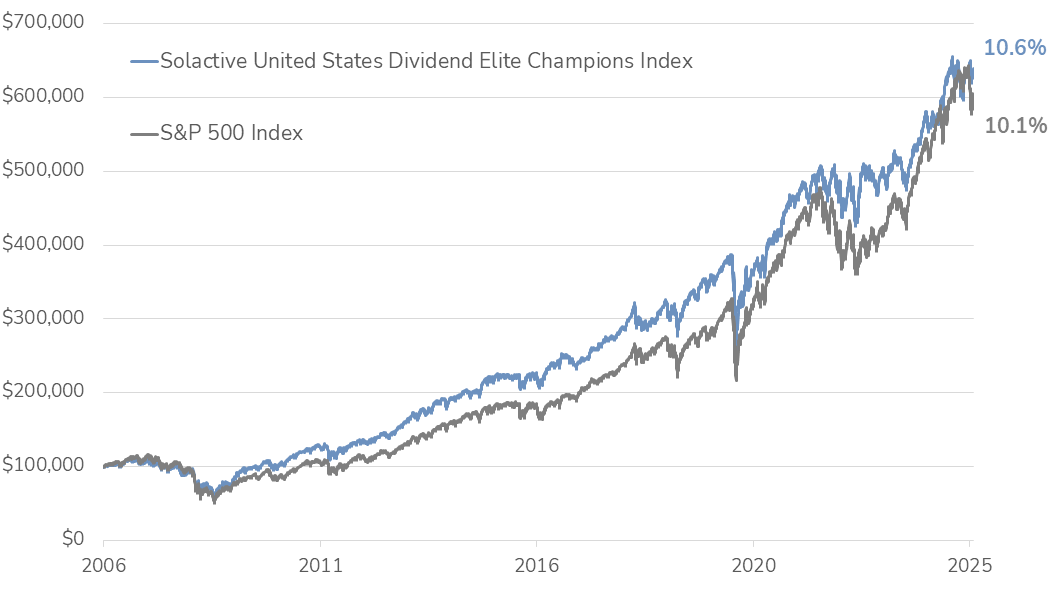
DISCLAIMERSource: Bloomberg, Solactive AG. Data from November 1, 2006 to March 31, 2025.
The graph illustrates the growth of an initial investment of $100,000 in the Solactive United States Dividend Elite Champions Index (SDLUSCT) vs. the S&P 500 Total Return Index with annual compounded total returns. The graph is for illustrative purposes only and intended to demonstrate the historical impact of the indexes compound growth rate. It is not a projection of future index performance, nor does it reflect potential returns on investments in the ETF. Investors cannot directly invest in the index. All performance data assumes reinvestment of distributions and excludes management fees, transaction costs, and other expenses which would have impacted an investor’s returns. SDLUSCT data prior to December 31, 2024 is hypothetical back-tested data using actual historical market data. Actual performance may have been different had the index been live during that period.
SMVP — Index Characteristics
SMVP — Index Performance & Risk
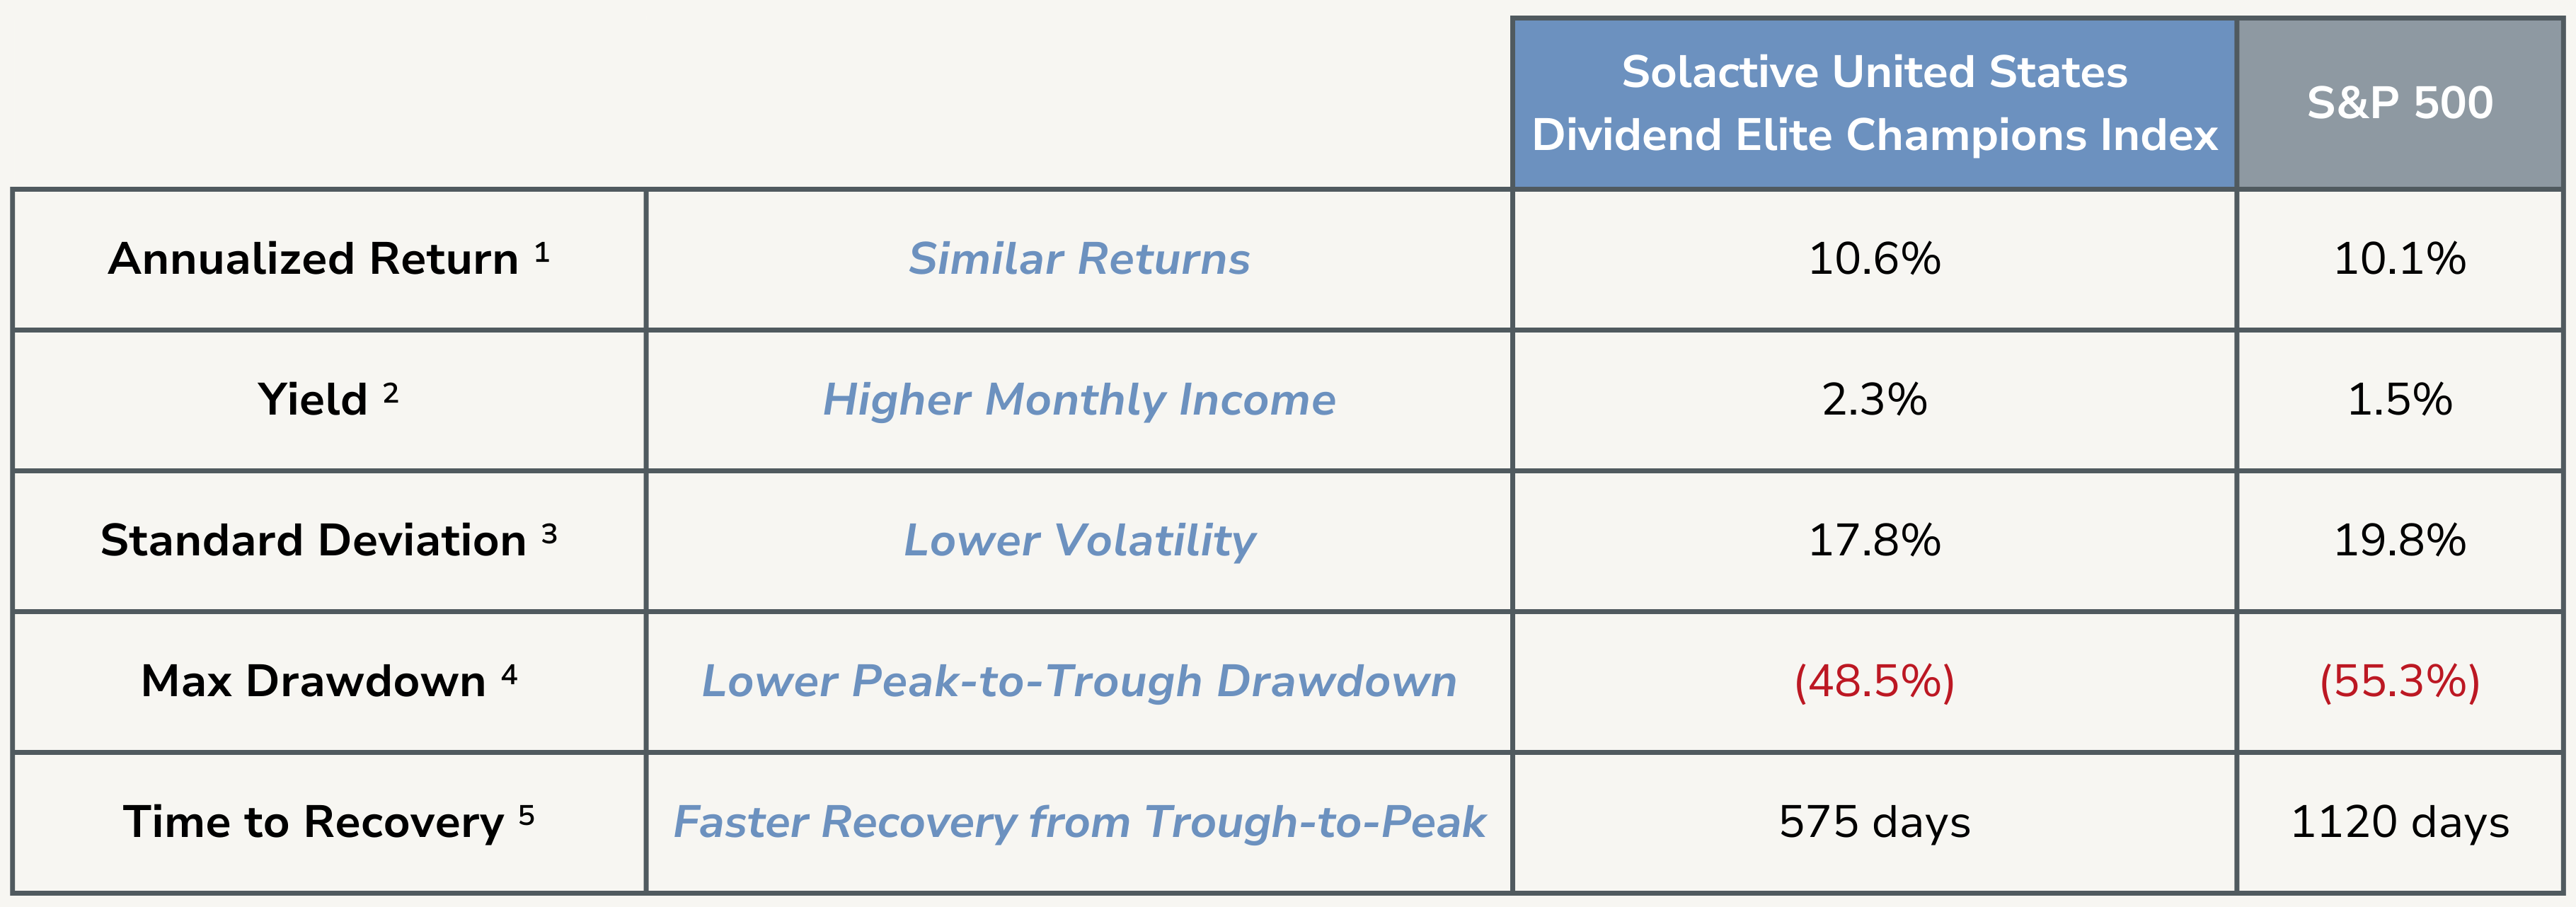
DEFINITIONS / DISCLAIMERSource: Bloomberg, Solactive AG. Data from November 1, 2006 to March 31, 2025.1. Annualized Return: The annualized total rate of return; 2. Yield: The annual dividend income expressed as a percentage of the share price on March 31, 2025; 3. Standard Deviation: A measure of an investment’s return volatility, indicating the degree of variation from its average return; 4. Max Drawdown: The largest percentage drop from an investment’s peak value to its lowest point; 5. Time to Recovery: The time it takes for an investment to recover from a drawdown and reach its previous peak value;
These projections are uncertain and may be influenced by factors such as market volatility, economic conditions, and company performance. Investors should not rely solely on these projections when making investment decisions. Past performance is not indicative of future results. Investors cannot directly invest in the index. All performance data assumes reinvestment of distributions, and excludes management fees, transaction costs, and other expenses which would have impacted an investor’s results. Solactive United States Dividend Elite Champions Index data prior to December 31, 2024 is hypothetical back-tested data using actual historical market data. Actual performance may have been different had the index been live during that period.
Blue-Chip U.S. Dividend Champions

- Overview
- Distributions
- Documents
█ Industrials 18.9%
█ Health Care 11.6%
█ Materials 11.8%
█ Financials 8.9%
█ Information Technology 6.3%
█ Energy 6.2%
█ Utilities 6.2%
█ Real Estate 3.0%
█ Consumer Discretionary 5.6%
| ticker | name | weight |
| ED | Consolidated Edison Inc | 3.4% |
| ROP | Roper Technologies Inc | 3.2% |
| JNJ | Johnson & Johnson | 3.1% |
| KO | Coca-Cola Co/The | 3.1% |
| CB | Chubb Ltd | 3.1% |
| XOM | Exxon Mobil Corp | 3.1% |
| IBM | International Business Machine | 3.1% |
| CVX | Chevron Corp | 3.1% |
| KMB | Kimberly-Clark Corp | 3.1% |
| LIN | Linde PLC | 3.1% |
| MCD | McDonald's Corp | 3.0% |
| ECL | Ecolab Inc | 3.0% |
| O | Realty Income Corp | 3.0% |
| MDT | Medtronic PLC | 3.0% |
| FAST | Fastenal Co | 2.9% |
| AFL | Aflac Inc | 2.9% |
| CL | Colgate-Palmolive Co | 2.9% |
| ADP | Automatic Data Processing Inc | 2.9% |
| SHW | Sherwin-Williams Co/The | 2.9% |
| GD | General Dynamics Corp | 2.9% |
| PG | Procter & Gamble Co/The | 2.9% |
| APD | Air Products and Chemicals Inc | 2.9% |
| LLY | Eli Lilly & Co | 2.8% |
| SPGI | S&P Global Inc | 2.8% |
| PEP | PepsiCo Inc | 2.8% |
| NEE | NextEra Energy Inc | 2.8% |
| ITW | Illinois Tool Works Inc | 2.7% |
| SYY | Sysco Corp | 2.7% |
| BDX | Becton Dickinson & Co | 2.7% |
| WMT | Walmart Inc | 2.6% |
| GWW | WW Grainger Inc | 2.6% |
| LOW | Lowe's Cos Inc | 2.5% |
| CAT | Caterpillar Inc | 2.5% |
| EMR | Emerson Electric Co | 2.5% |
| TGT | Target Corp | 2.0% |
| Ticker | SMVP |
| Exchange | Toronto Stock Exchange (TSX) |
| CUSIP | 407053107 |
| Inception Date | January 24, 2025 |
| Investment Style | Equal-weight, Index-based |
| Benchmark | Solactive United States Dividend Elite Champions Index |
| Assets | $10.2M CAD* |
| Distributions | Monthly |
| Rebalancing | Quarterly |
| Currency Hedging | 100% Hedged |
| Management Fee | 0.00%* |
| Risk Rating | Medium |
| Auditor | KPMG LLP |
| Legal Entity Identifier | 254900OJ63LER45S6X29 |
| Ex-Dividend Date | Pay Date | Frequency | Amount |
|---|---|---|---|
| 2025-03-31 | 2025-04-07 | Monthly | $0.0240 |
| 2025-02-28 | 2025-03-07 | Monthly | $0.0240 |