
HAMILTON CHAMPIONS™ Canadian Dividend Index ETF
Canadian All-Star Dividend Growers

HIGHLIGHTS
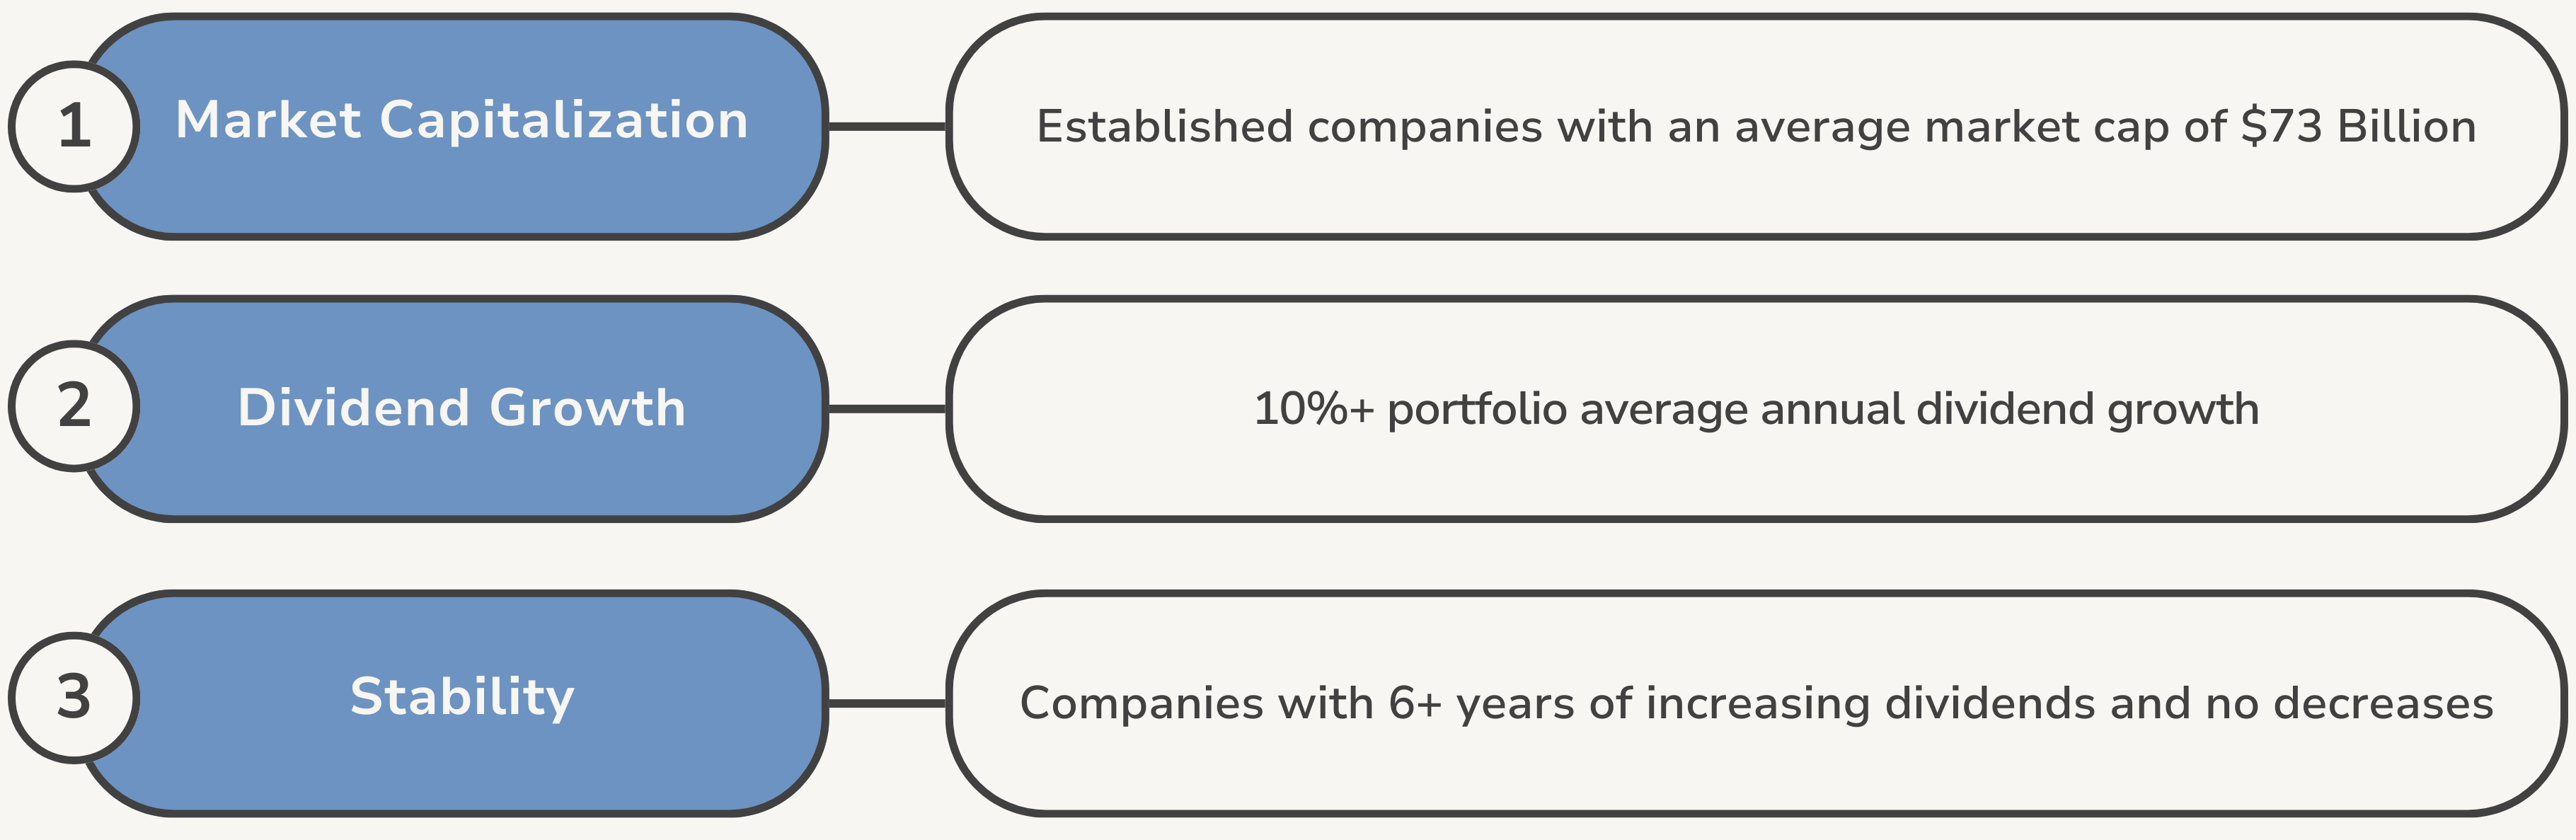
Equal-weight portfolio of blue-chip Canadian companies with a long history of stable and increasing dividend payments
0% management fee through January 31, 2026*Annual management fee rebated by 0.19% to an effective management fee of 0.00% at least until January 31, 2026
Index Outperformance vs. S&P/TSX 60 with lower volatility*Based on the total return of the Solactive Canada Dividend Elite Champions Index (SDLCACT) vs. S&P/TSX 60 Index. Since November 1, 2006, as at March 31, 2025. SDLCACT data prior to December 31, 2024, is hypothetical back-tested data using actual historical market data. Source: Bloomberg, Solactive AG, Hamilton ETFs
A GOOD FIT FOR INVESTORS WHO WANT
Low-cost exposure to Canadian dividend growing companies
Tax efficiency from Canadian eligible dividends
Lower volatility with the potential for long-term outperformance


Performance
- TICKER CMVP
- NAV $16.10
- 1 DAY CHANGE +$0.00
-
LAST DISTRIBUTION *
Last distribution per unit. Distributions are subject to change. For a complete list of historical distributions, please see the Distributions tab below.
$0.046 - ASSETS $21.1M
CMVP — Index Outperformance vs. S&P/TSX 60
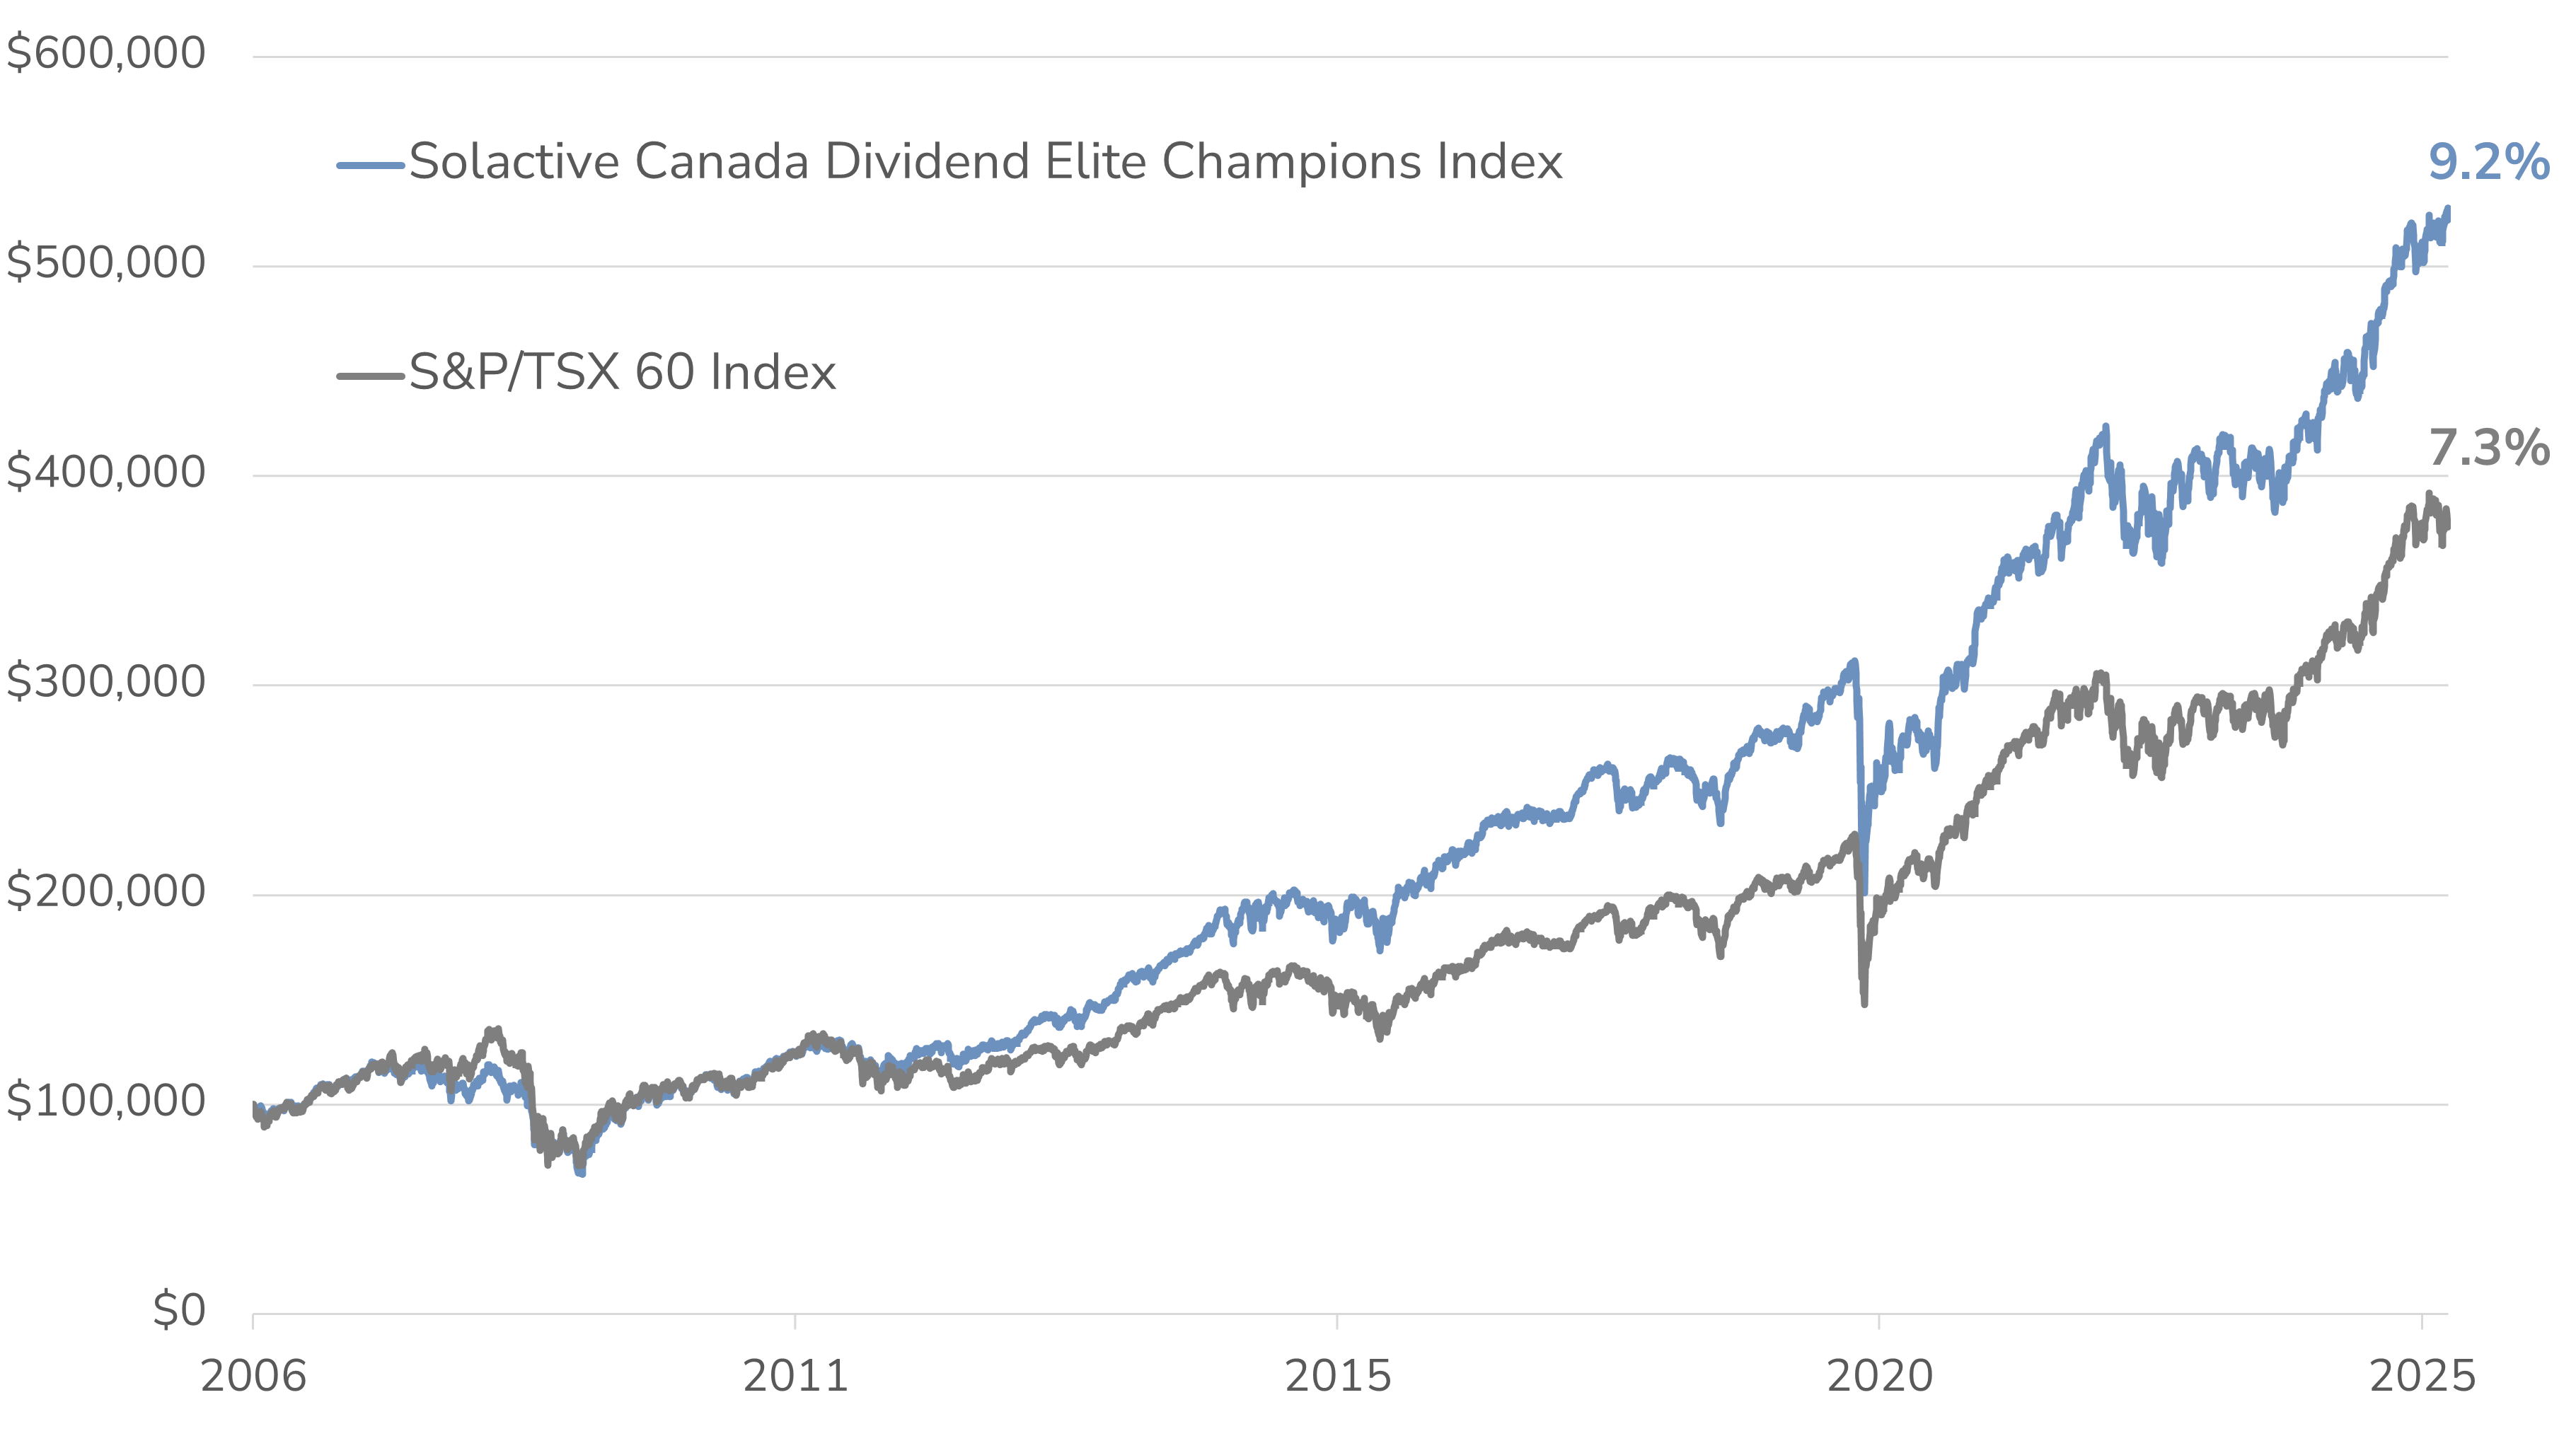
DISCLAIMERSource: Bloomberg, Solactive AG. Data from May 8, 2006 to March 31, 2025.
The graph illustrates the growth of an initial investment of $100,000 in the Solactive Canada Dividend Elite Champions Index (SDLCACT) vs. the S&P/TSX 60 Total Return Index with annual compounded total returns. The graph is for illustrative purposes only and intended to demonstrate the historical impact of the indexes compound growth rate. It is not a projection of future index performance, nor does it reflect potential returns on investments in the ETF. Investors cannot directly invest in the index. All performance data assumes reinvestment of distributions and excludes management fees, transaction costs, and other expenses which would have impacted an investor’s returns. SDLCACT data prior to December 31, 2024, is hypothetical back-tested data using actual historical market data. Actual performance may have been different had the index been live during that period.
CMVP — Index Characteristics
CMVP — Index Performance & Risk
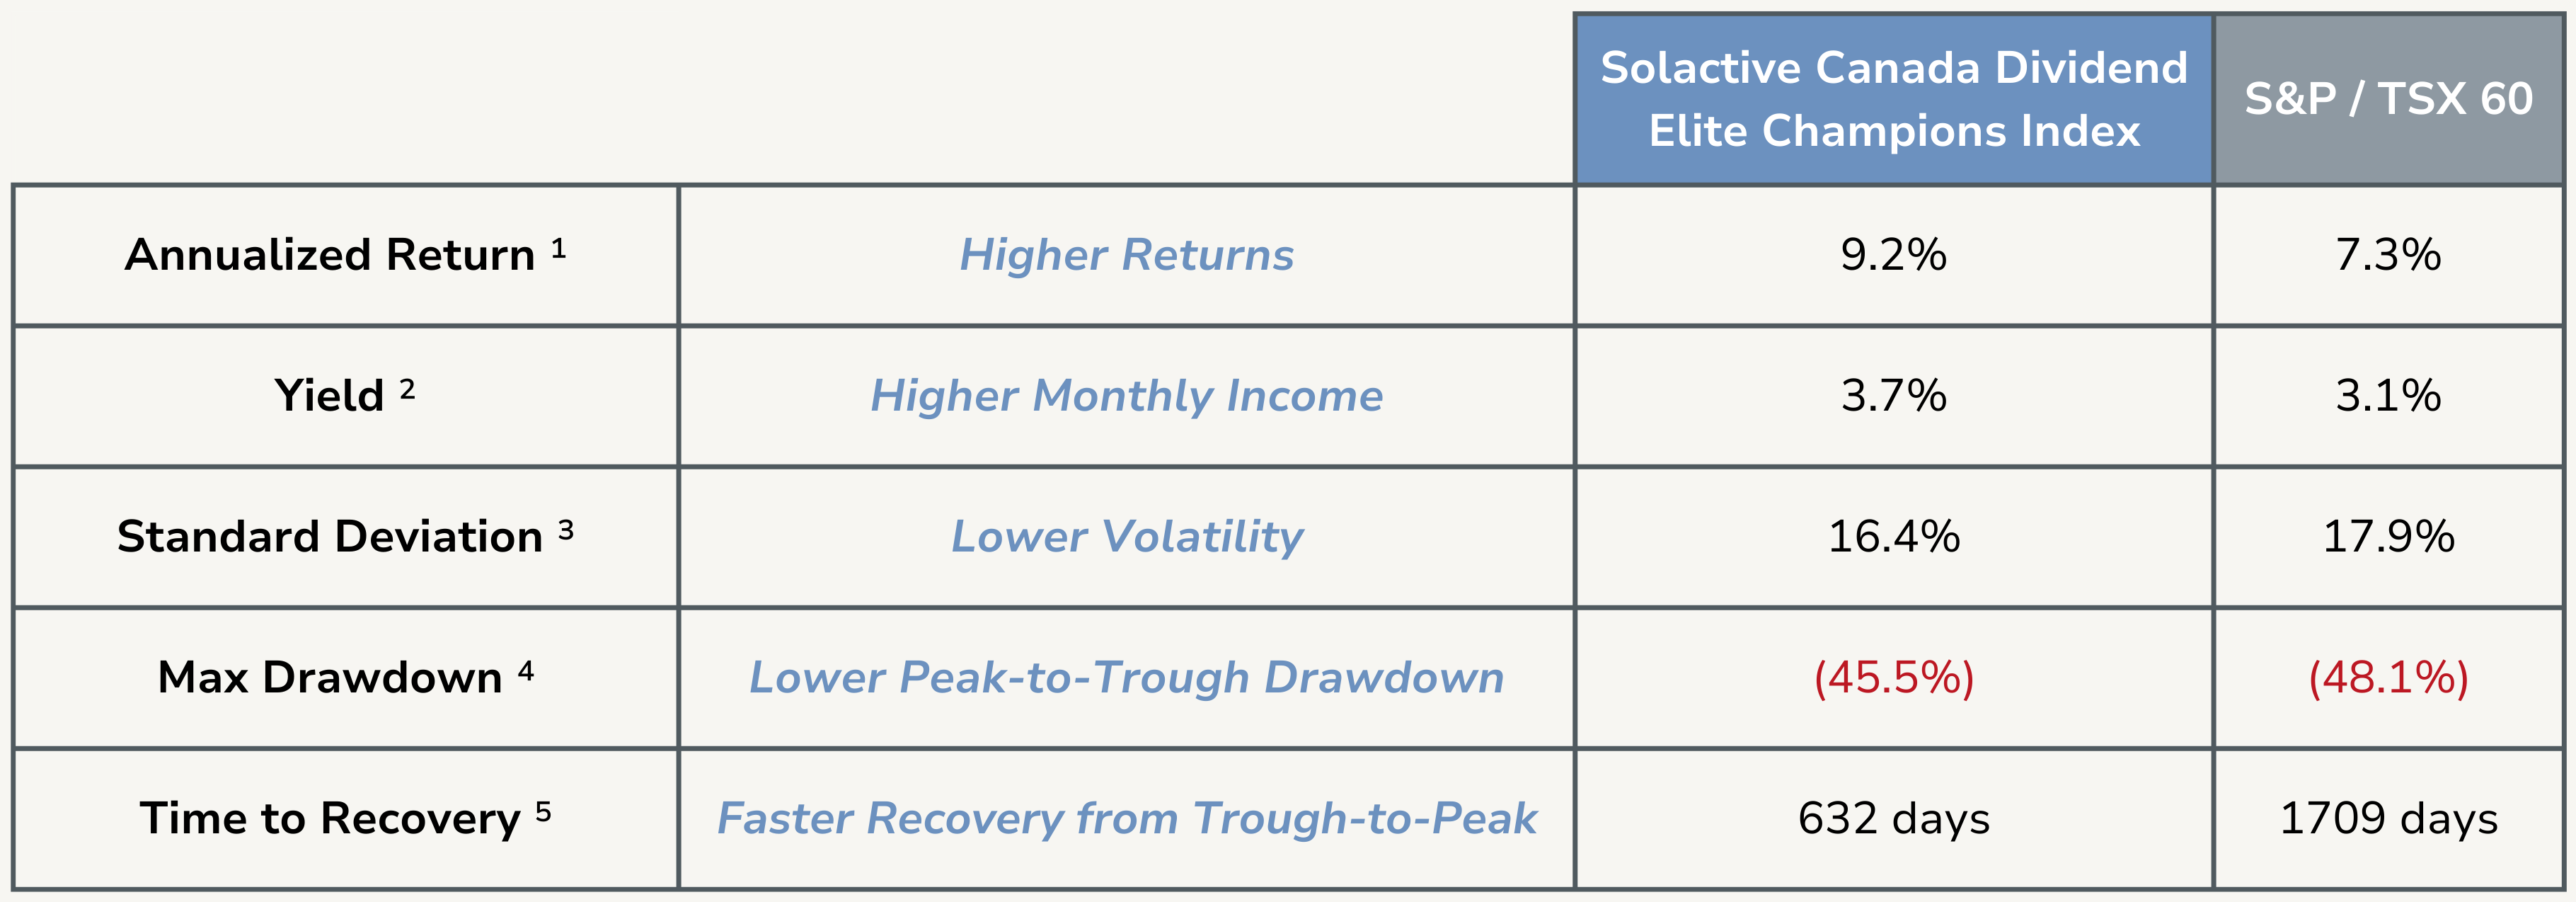
DEFINITIONS / DISCLAIMERSource: Bloomberg, Solactive AG. Data from May 8, 2006 to March 31, 2025.1. Annualized Return: The annualized total rate of return; 2. Yield: The annual dividend income expressed as a percentage of the share price on March 31, 2025; 3. Standard Deviation: A measure of an investment’s return volatility, indicating the degree of variation from its average return; 4. Max Drawdown: The largest percentage drop from an investment’s peak value to its lowest point; 5. Time to Recovery: The time it takes for an investment to recover from a drawdown and reach its previous peak value;
These projections are uncertain and may be influenced by factors such as market volatility, economic conditions, and company performance. Investors should not rely solely on these projections when making investment decisions. Past performance is not indicative of future results. Investors cannot directly invest in the index. All performance data assumes reinvestment of distributions, and excludes management fees, transaction costs, and other expenses which would have impacted an investor’s results. Solactive Canada Dividend Elite Champions Index data prior to December 31, 2024 is hypothetical back-tested data using actual historical market data. Actual performance may have been different had the index been live during that period.
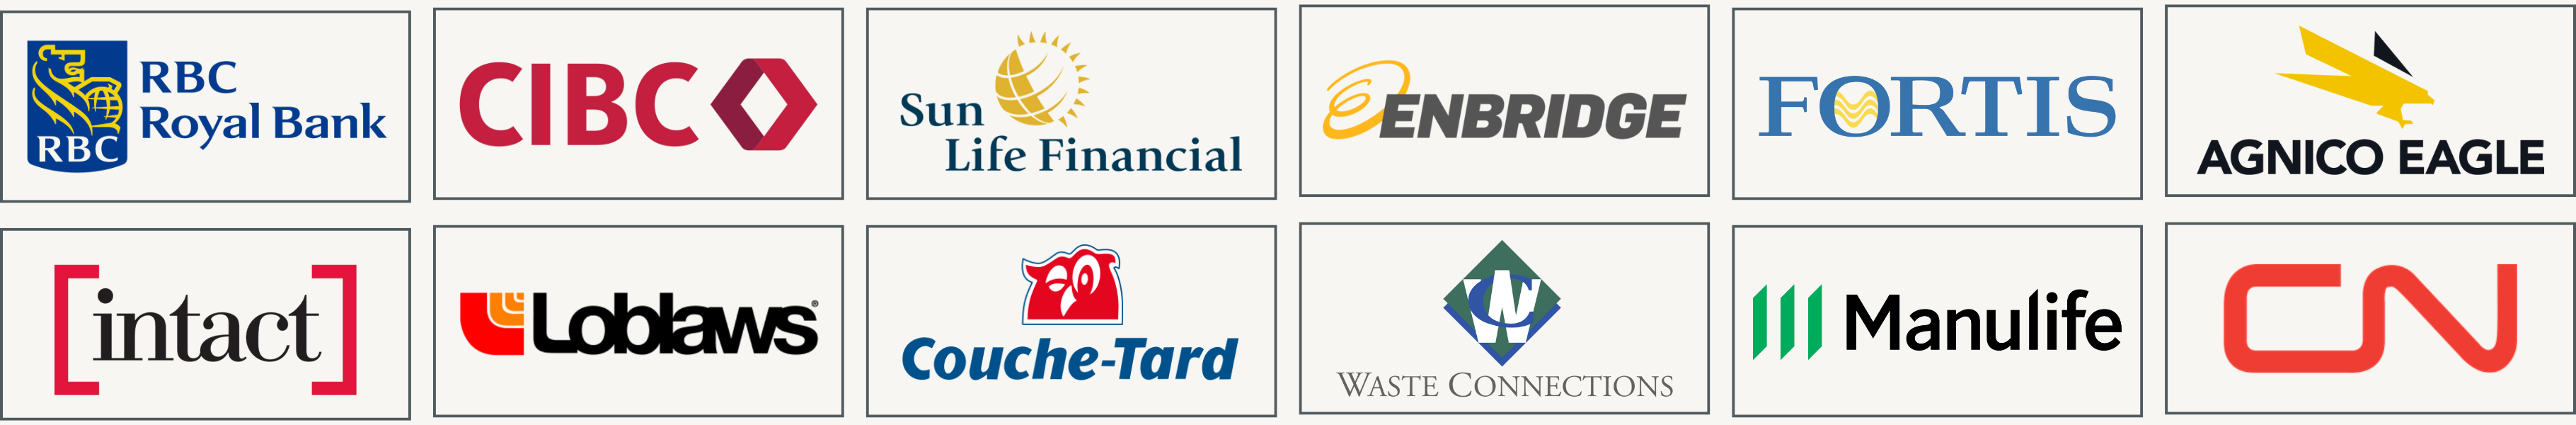
Blue-Chip Canadian Dividend Champions
- Overview
- Distributions
- Documents
█ Energy 15.5%
█ Materials 14.9%
█ Industrials 11.5%
█ Consumer Staples 8.0%
█ Communication Services 7.7%
█ Consumer Discretionary 3.2%
█ Utilities 4.2%
| ticker | name | weight |
| WPM | Wheaton Precious Metals Corp | 5.1% |
| AEM | Agnico Eagle Mines Ltd | 5.0% |
| FNV | Franco-Nevada Corp | 4.8% |
| L | Loblaw Cos Ltd | 4.3% |
| WCN | Waste Connections Inc | 4.3% |
| IFC | Intact Financial Corp | 4.3% |
| TD | Toronto-Dominion Bank/The | 4.3% |
| FTS | Fortis Inc/Canada | 4.2% |
| T | TELUS Corp | 4.0% |
| MFC | Manulife Financial Corp | 4.0% |
| ENB | Enbridge Inc | 4.0% |
| TOU | Tourmaline Oil Corp | 4.0% |
| TRP | TC Energy Corp | 3.9% |
| BMO | Bank of Montreal | 3.8% |
| SLF | Sun Life Financial Inc | 3.8% |
| CNQ | Canadian Natural Resources Ltd | 3.7% |
| BCE | BCE Inc | 3.7% |
| RY | Royal Bank of Canada | 3.6% |
| CNR | Canadian National Railway Co | 3.6% |
| ATD | Alimentation Couche-Tard Inc | 3.6% |
| BNS | Bank of Nova Scotia/The | 3.6% |
| CP | Canadian Pacific Kansas City L | 3.6% |
| CM | Canadian Imperial Bank of Comm | 3.5% |
| NA | National Bank of Canada | 3.5% |
| MG | Magna International Inc | 3.2% |
| Ticker | CMVP |
| Exchange | Toronto Stock Exchange (TSX) |
| CUSIP | 406913103 |
| Inception Date | January 24, 2025 |
| Investment Style | Equal-weight, Index-based |
| Benchmark | Solactive Canada Dividend Elite Champions Index |
| Assets | $21.1M CAD* |
| Distributions | Monthly |
| Rebalancing | Quarterly |
| Management Fee | 0.00%* |
| Risk Rating | Medium |
| Auditor | KPMG LLP |
| Legal Entity Identifier | 2549000HGV62P7ZKC672 |
| Ex-Dividend Date | Pay Date | Frequency | Amount |
|---|---|---|---|
| 2025-03-31 | 2025-04-07 | Monthly | $0.0460 |
| 2025-02-28 | 2025-03-07 | Monthly | $0.0460 |