
Hamilton Enhanced Mixed Asset ETF
Coming Soon: A Better All-In-One ETF

HIGHLIGHTS
Innovative all-in one ETF combining U.S. stocks (60%), U.S. treasuries (20%) and Gold (20%)
Enhanced growth potential from modest 25% leverage
Tracks an index that, after modest 25% leverage, has historically outperformed the S&P 500 with lower volatility
0% management fee until April 30, 2026 (0.35% thereafter)*Annual management fee rebated by 0.35% to an effective management fee of 0.00% at least until April 30, 2026
A GOOD FIT FOR INVESTORS WHO WANT
A core buy-and-hold growth ETF
Enhanced returns with historically lower volatility and drawdowns vs. S&P 500
Convenient multi-asset diversification with automatic rebalancing if any weight drifts ±2% from target allocation
A low-cost solution designed for resilience through economic cycles
FUND OBJECTIVE
MIX seeks to replicate a 1.25 times multiple of the Solactive Hamilton Mixed Asset Index (“Mixed Asset Index”).
➣ 60% Stocks for growth
➣ 20% Bonds for stability
➣ 20% Gold for resilience


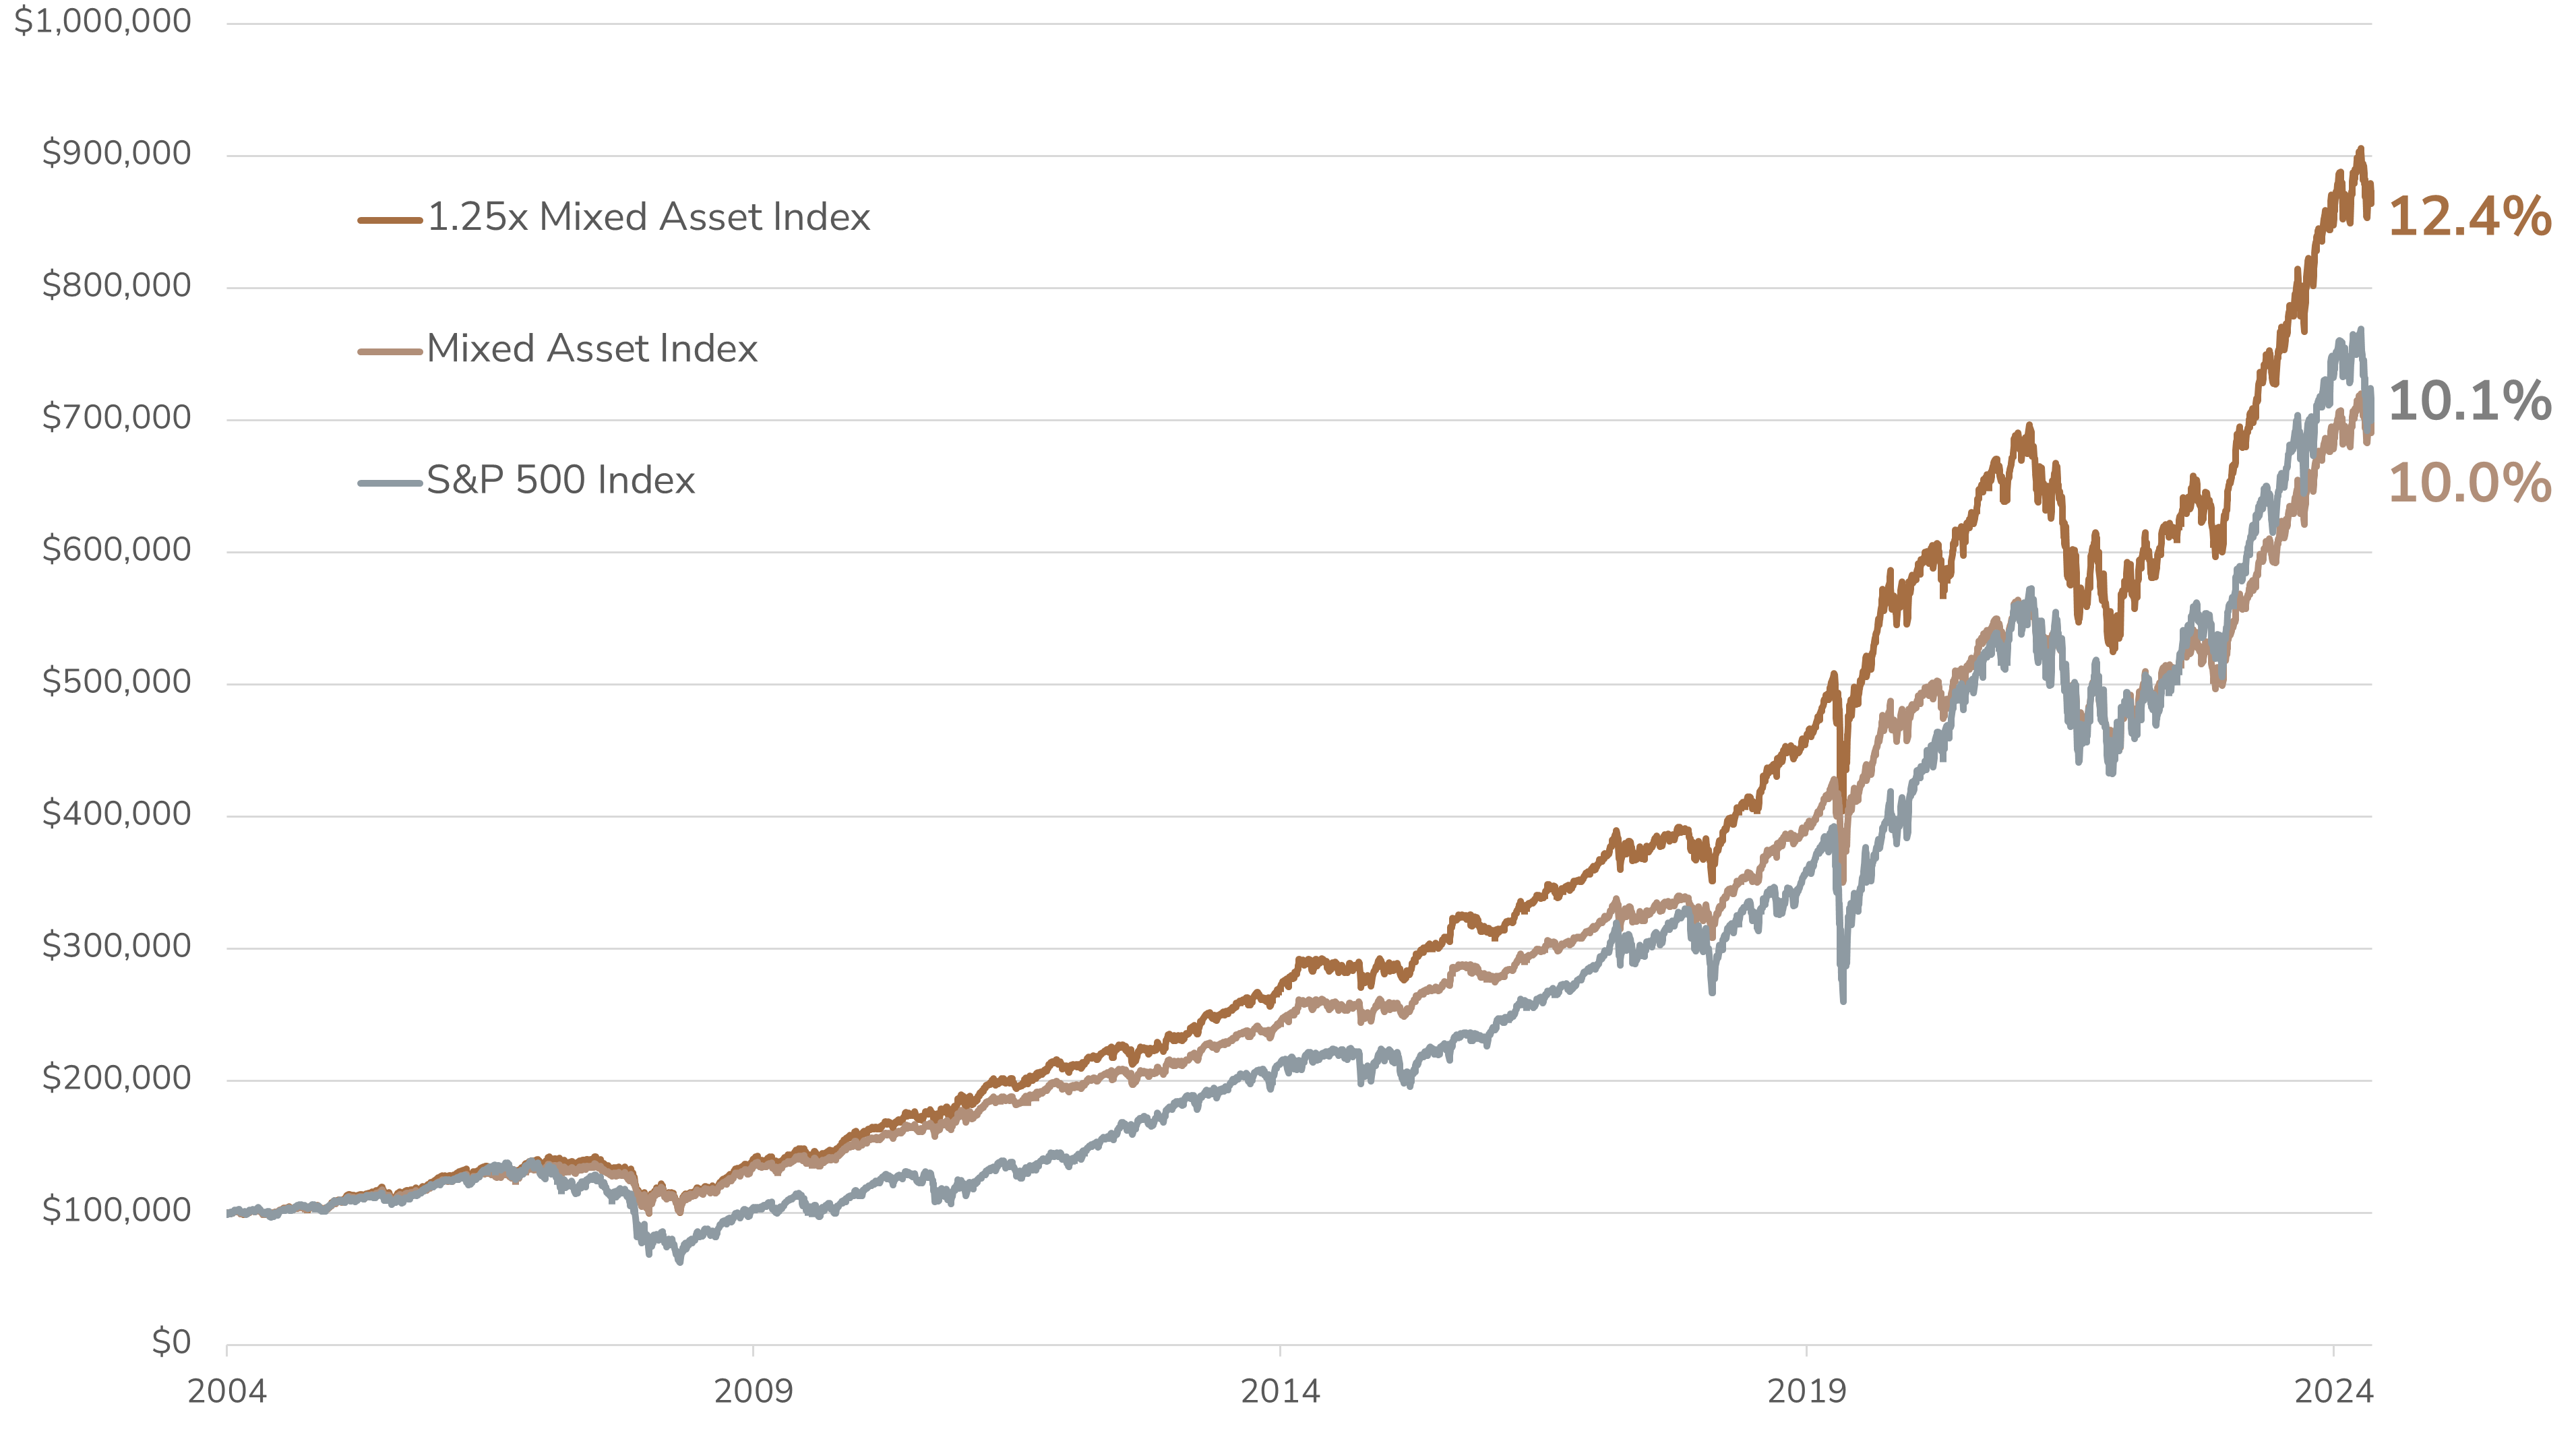
MIX — Index Performance vs. S&P 500
DISCLAIMERSource: S&P Global, Solactive AG, Hamilton ETFs. Data from November 18, 2004, to March 31, 2025.
The graph illustrates the growth of an initial investment of $100,000 in USD the Solactive Hamilton Mixed Asset Index (SOLHAMMA) vs. the S&P 500 Total Return Index with annual compounded total returns and the potential impact of 1.25x leveraged exposure to SOLHAMMA. The graph is for illustrative purposes only and intended to demonstrate the historical impact of the indexes compound growth rate. It is not a projection of future index performance, nor does it reflect potential returns on investments in the ETF. Investors cannot directly invest in the index. All performance data assumes reinvestment of distributions and excludes management fees, transaction costs, and other expenses which would have impacted an investor’s returns. SOLHAMMA data prior to March 31, 2025, is hypothetical back-tested data using actual historical market data. Actual performance may have been different had the index been live during that period.
The S&P 500 Index (“Index”) and associated data are a product of S&P Dow Jones Indices LLC, its affiliates and/or their licensors and has been licensed for use by Hamilton ETFs © 2025 S&P Dow Jones Indices LLC, its affiliates and/or their licensors. All rights reserved. Redistribution or reproduction in whole or in part are prohibited without written permission of S&P Dow Jones Indices LLC. For more information on any of S&P Dow Jones Indices LLC’s indices please visit www.spdji.com. S&P® is a registered trademark of Standard & Poor’s Financial Services LLC (“SPFS”) and Dow Jones® is a registered trademark of Dow Jones Trademark Holdings LLC (“Dow Jones”). Neither S&P Dow Jones Indices LLC, SPFS, Dow Jones, their affiliates nor their licensors (“S&P DJI”) make any representation or warranty, express or implied, as to the ability of any index to accurately represent the asset class or market sector that it purports to represent and S&P DJI shall have no liability for any errors, omissions, or interruptions of any index or the data included therein.
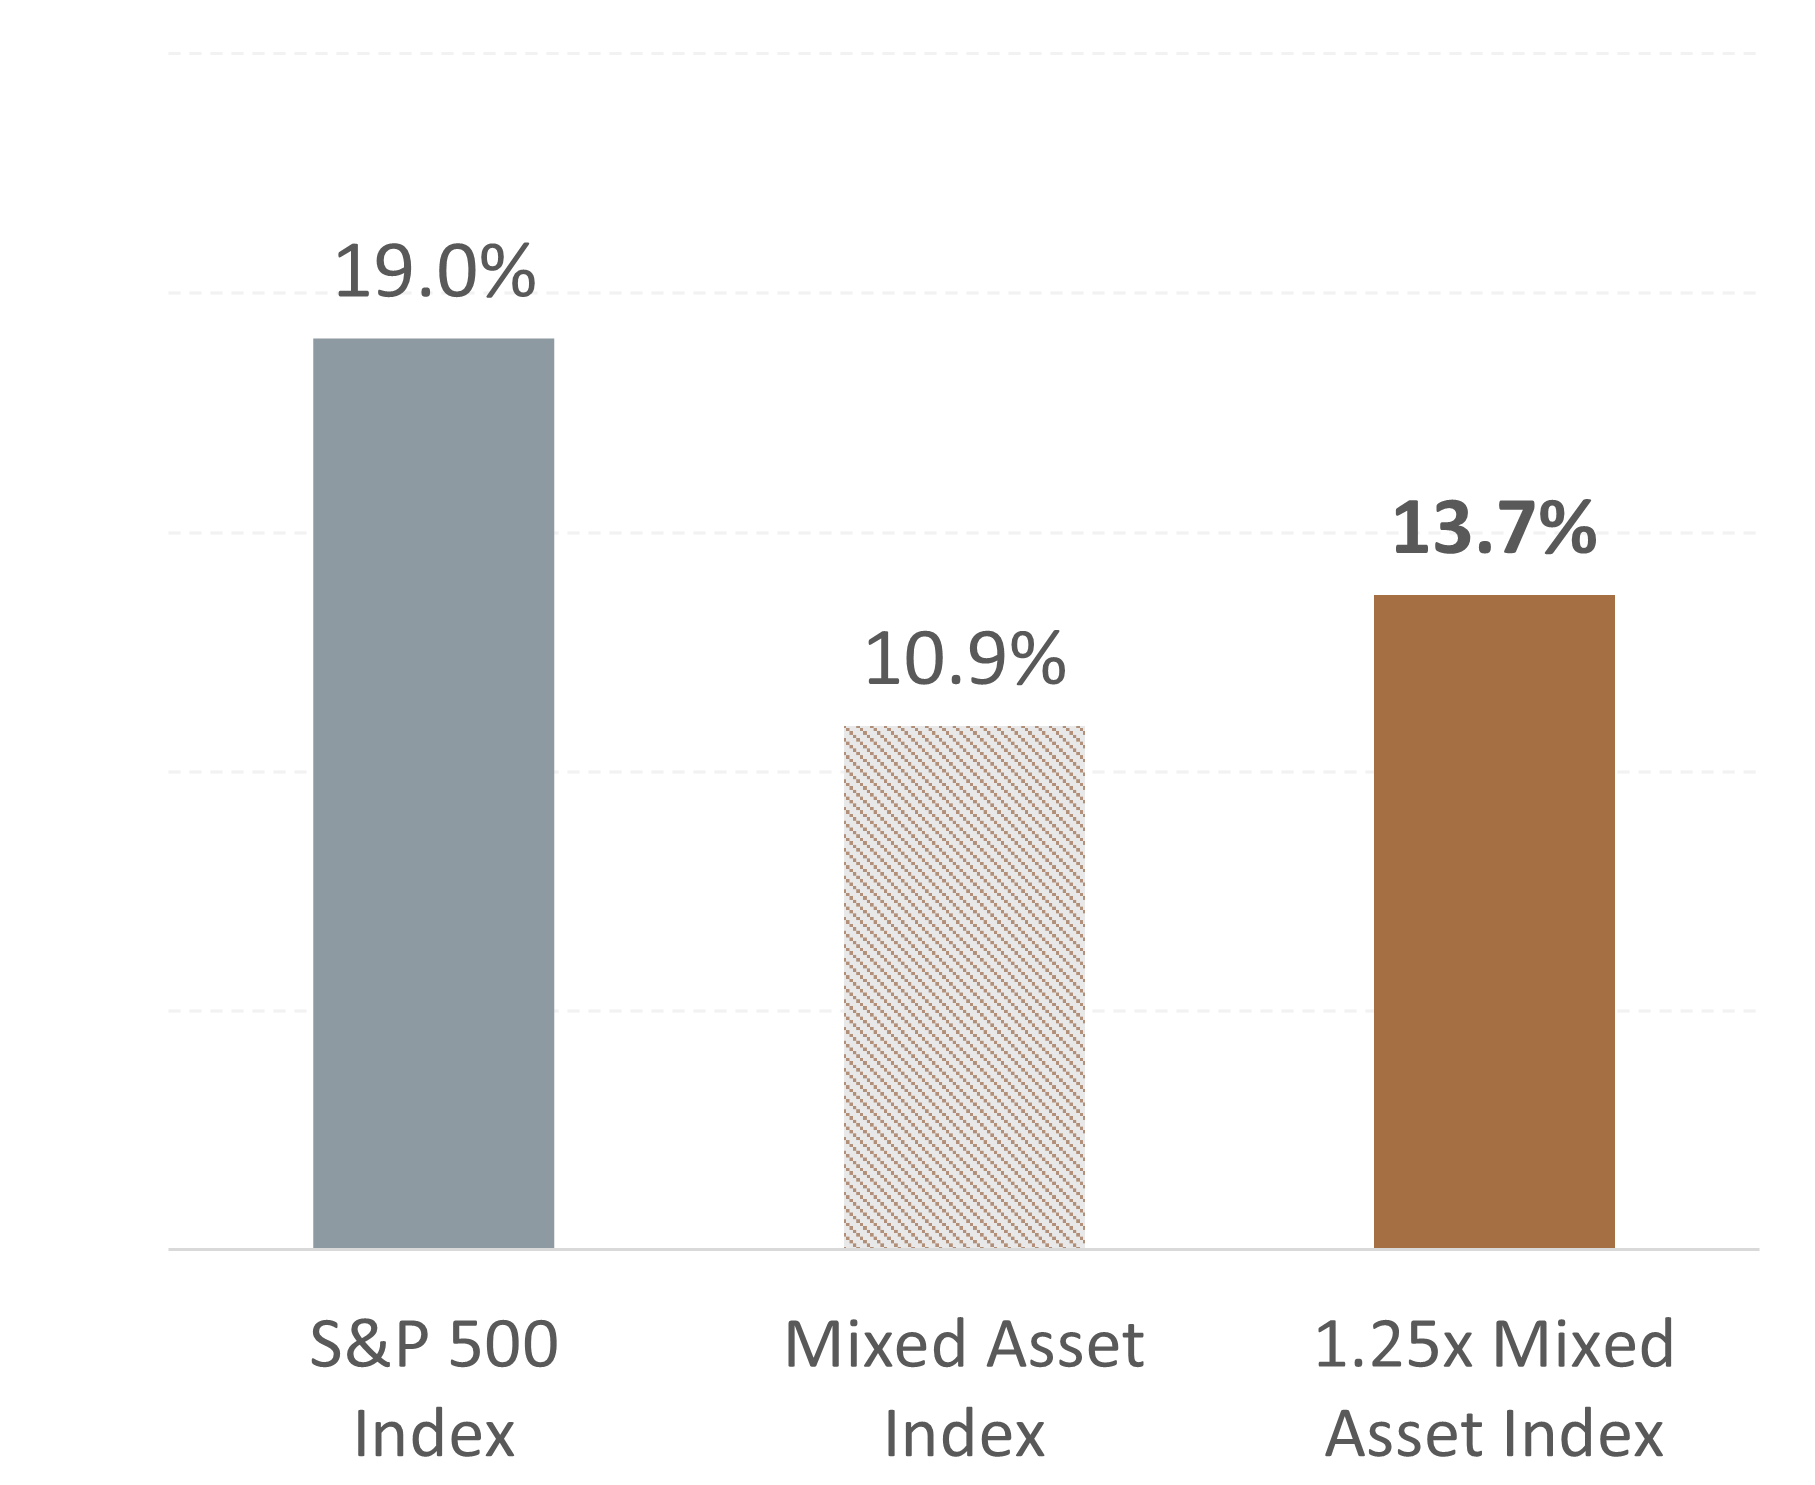
Standard Deviation
Lower Volatility, Even After Modest Leverage
DISCLAIMERSource: S&P Global, Solactive AG, Hamilton ETFs. Data from November 18, 2004, to March 31, 2025.
Volatility is measured using standard deviation, which quantifies how much an investment’s returns deviate from its average return over a given period.
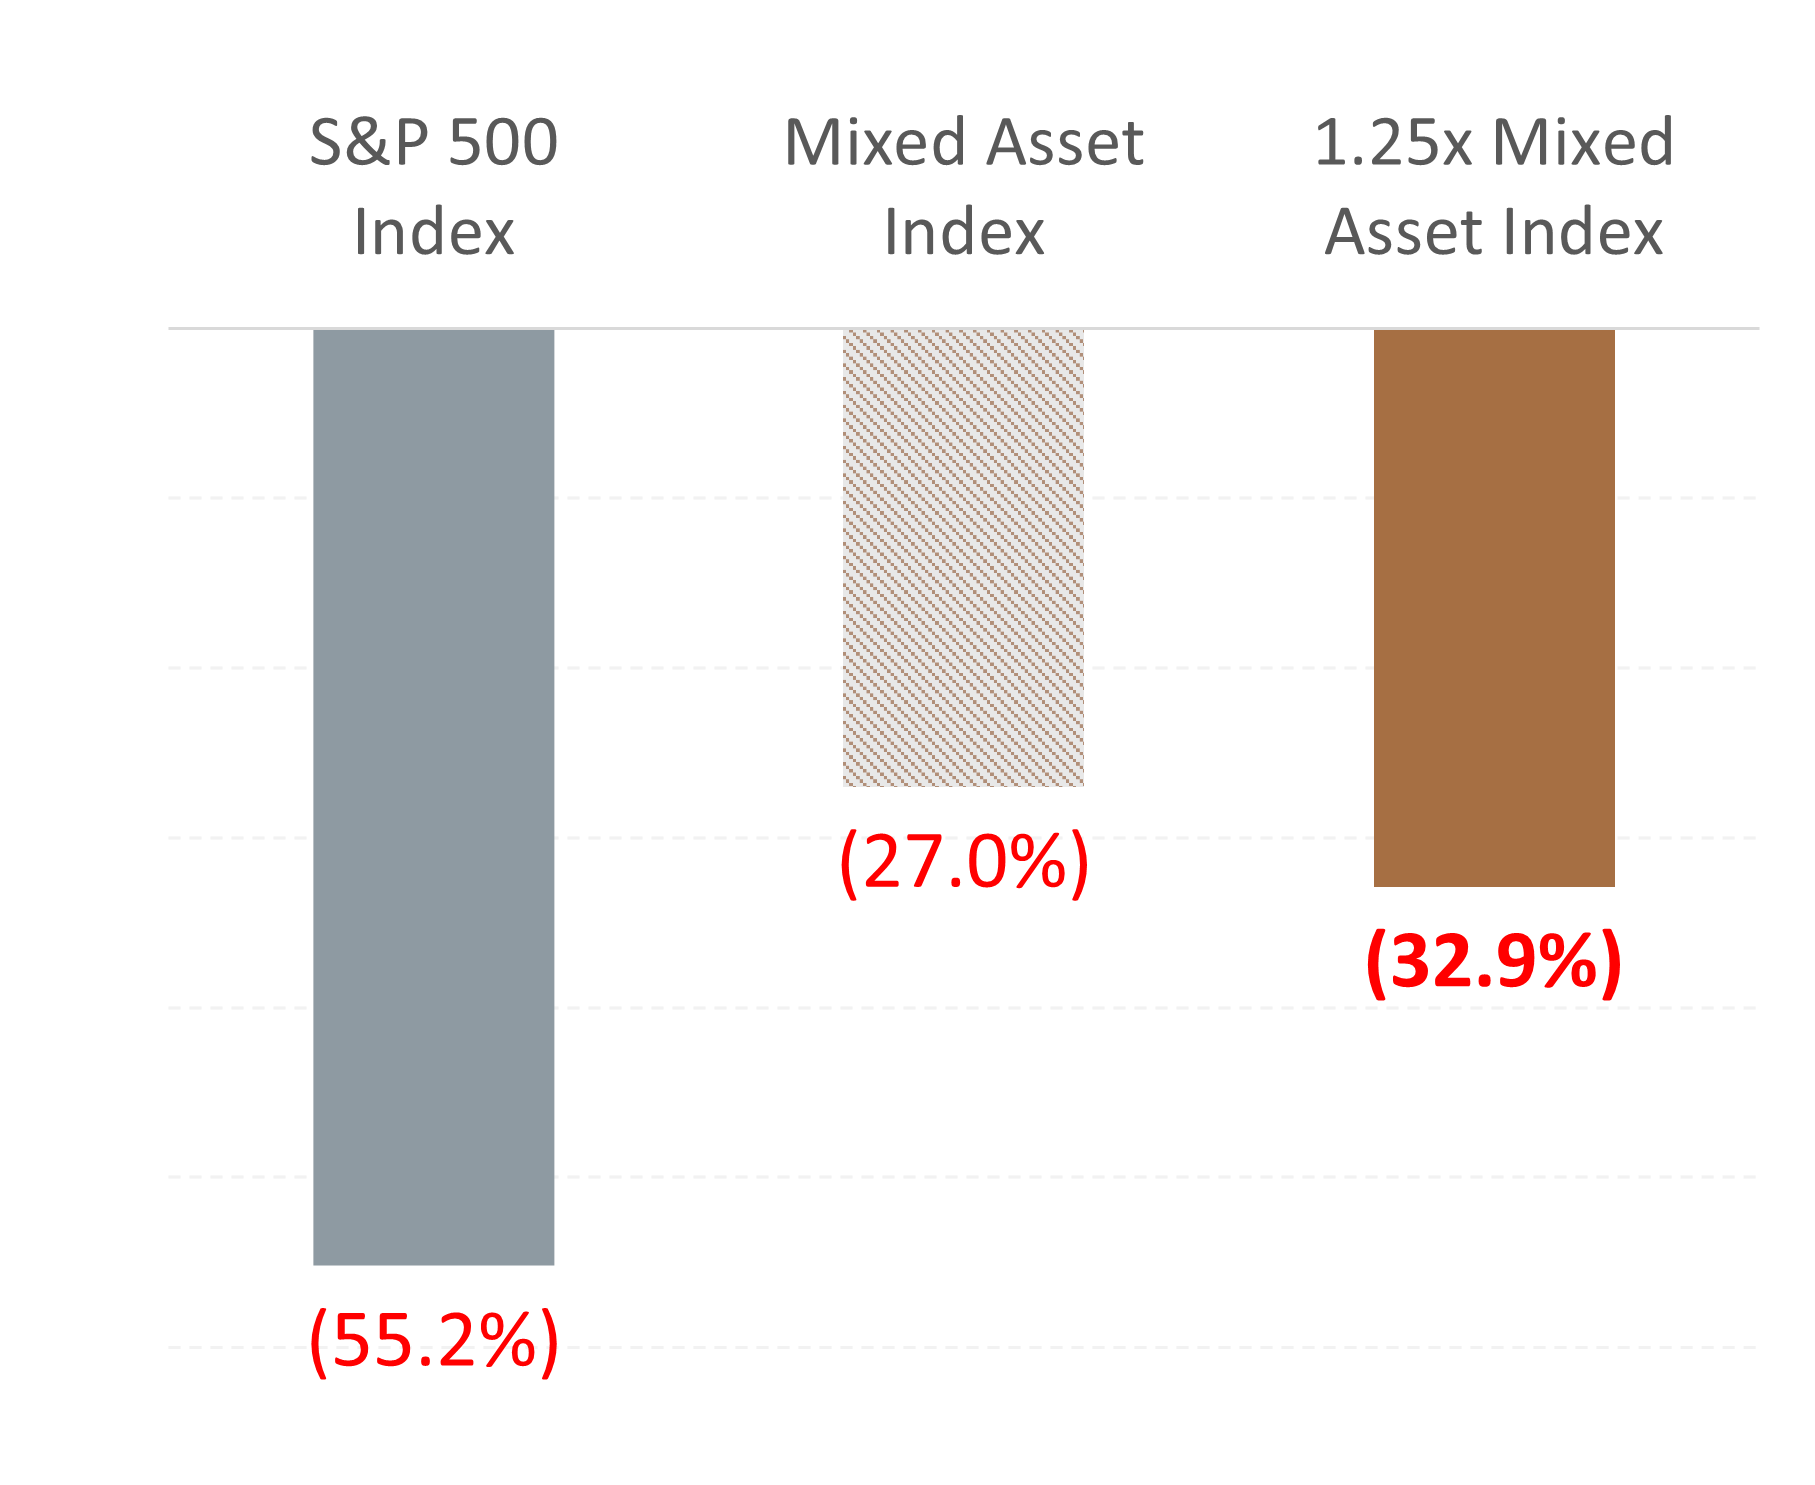
Maximum Drawdown
CLICK HERE to see the 50 Worst Market Declines
DISCLAIMERSource: S&P Global, Solactive AG, Hamilton ETFs. Data from November 18, 2004, to March 31, 2025.
Drawdown: The percentage drop from an investment’s peak value to its lowest point.
- Overview
- Distributions
- Documents
█ Fixed Income 20.0%
█ Gold 20.0%
| ticker | name | weight |
| VOO | Vanguard S&P 500 ETF | 75.00% |
| VGLT | Vanguard Long-Term Treasury ETF | 25.00% |
| ZGLD | BMO Gold Bullion ETF | 25.00% |
Please note the portfolio weights include modest ~25% leverage via cash borrowing (not derivatives), provided by a Canadian financial institution.
| Ticker | MIX |
| Exchange | Toronto Stock Exchange (TSX) |
| CUSIP | 406911107 |
| Anticipated Launch Date | April 28, 2025 |
| Investment Style | Index-based, Modest 25% Leverage |
| Benchmark | Solactive Hamilton Mixed Asset Index ("Mixed Asset Index") |
| Distributions | Quarterly |
| Rebalancing | Automatic rebalancing if any weight drifts ±2% from target allocation |
| Currency Hedging | USD exposure is fully hedged |
| Management Fee | 0.00%* |
| Risk Rating | Medium |
| Auditor | KPMG LLP |
| Legal Entity Identifier | 254900ON0L79PZ75B178 |
| Ex-Dividend Date | Pay Date | Frequency | Amount |
|---|---|---|---|
| 2025-06-30 | 2025-07-08 | Quarterly | TBA |